Blank control charts printable
Sponsored Link免费模板 保存,填空,打印,三步搞定!

Download Blank control charts printable
Adobe PDF (.pdf)其他可用语言:
- 本文档已通过专业认证
- 100%可定制
- 这是一个数字下载 (79.8 kB)
- 语: English
Sponsored Link

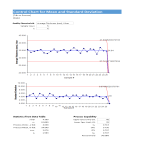
How to create a Control Chart? Start with example blank control charts that are downloadable and ready to print.
The Control Charts in this document is very useful and the most common types of control charts, for example, the X-Bar chart (which allows you to do plotting the mean of a sample over time). Also, you can find the S-chart (plotting the sample standard deviation over time and the R-chart (to do plotting of a range or Max-Min of a sample over time).
These blank control charts are based on the terminology used and that explains the formulas and steps for creating these control charts. This file contains blank control chart templates that can be used for statistical analysis. For example for Mean and Range, or sample Mean and Standard Deviation (2 worksheets in one). You can just put your own data in the charts, in order to visualize the data. Control limits are calculated based on the data you enter. In the X-bar & R control chart, the number of observations per sample (n) can be between 2 and 25. In the X-bar & S chart, n must be greater than 4.
Although there are many Statistical Process Control (SPC) software tools available to analyze and visualize data, it happens that researchers also create control charts in Excel or on a hardcopy.
For those, these blank Control Chart Templates can be very useful. Also, it can function as educational tools to teach children or adults and to make equations.
Download this Blank control charts now.
DISCLAIMER
Nothing on this site shall be considered legal advice and no attorney-client relationship is established.
发表评论。 如果您有任何问题或意见,请随时在下面发布
相关文件
Sponsored Link