Herringbone Diagram
Sponsored Link高级模板 保存,填空,打印,三步搞定!

下载 下载 How to make a professional Herringbone Diagram? this project management Herringbone Diagram template now!
只有今天: USD 2.49
点击购买

可用的免费文件格式:
(.pptx)其他可用语言:
- 本文档已通过专业认证
- 100%可定制
- 这是一个数字下载 (172.75 kB)
- 语: English
- 付款完成后,您将收到包含该文件的电子邮件。
Sponsored Link
How to make a professional Herringbone Diagram? Download this project management Herringbone Diagram template now!
Adequate communication is essential in projects, in order to have truthful and accurate information exchange in order to ensure program managers or project managers are able to do rationally and correct decision making. For those individuals, who make the biggest impacts, have, what we call, a "high-performance mindset” and are always working with the latest update of professional project management templates to achieve their goals faster!
Adequate communication is essential in projects, in order to have truthful and accurate information exchange in order to ensure program managers or project managers are able to do rationally and correct decision making. For those individuals, who make the biggest impacts, have, what we call, a "high-performance mindset” and are always working with the latest update of professional project management templates to achieve their goals faster!
An Ishikawa diagram is a diagram that shows the causes of an event and is often used in manufacturing and product development to outline the different steps in a process, demonstrate where quality control issues might arise, and determine which resources are required at specific times.
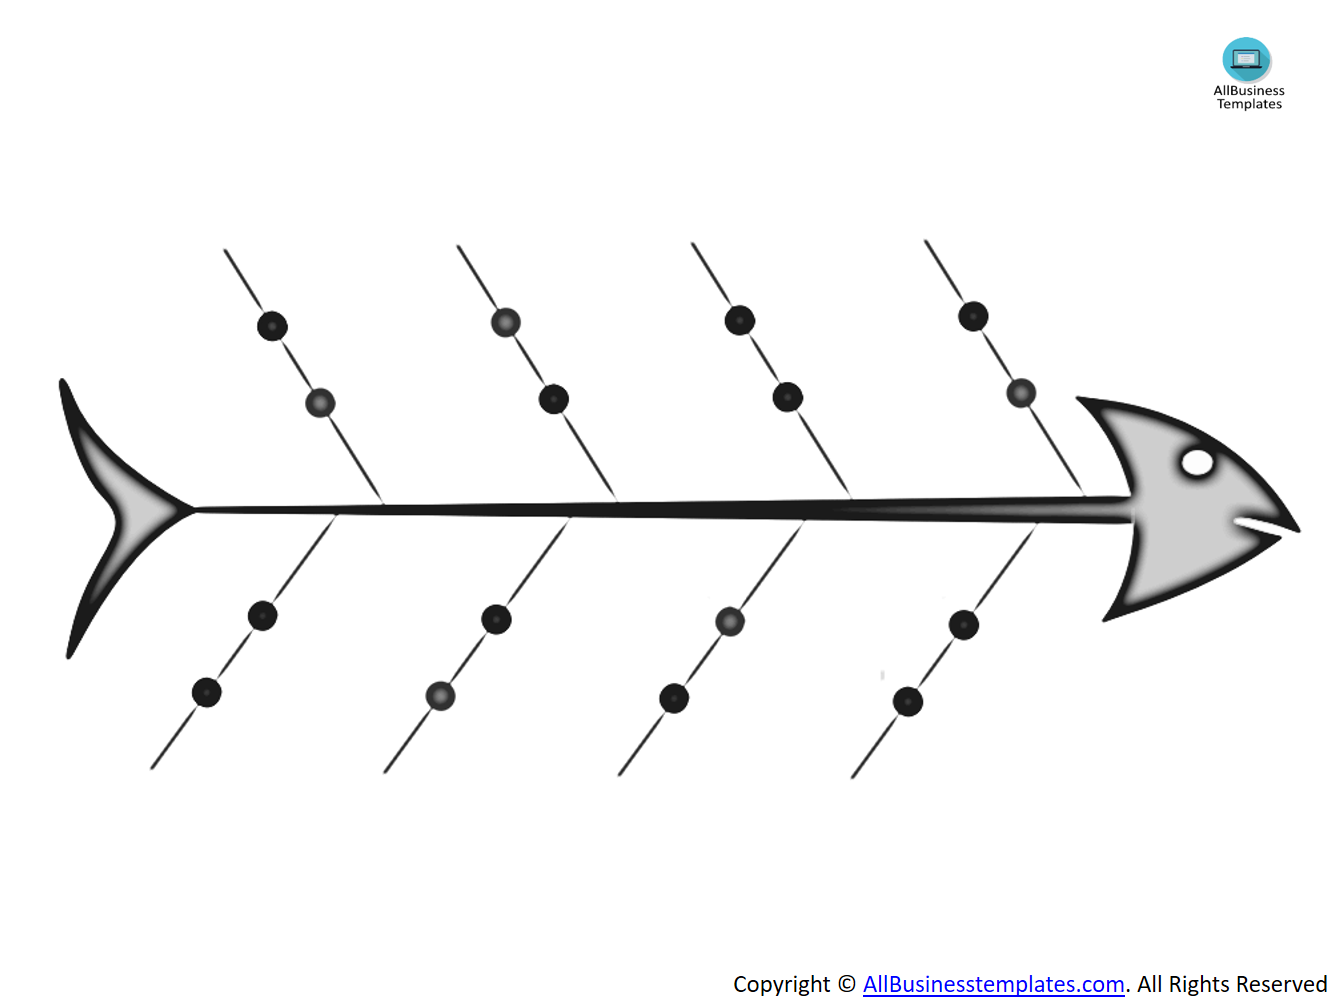
An Ishikawa diagram (also known as Fishbone diagram, herringbone diagram, Cause-Effect diagram) is an overview that visualizes the causes of an effect or event and is often used in manufacturing and product development. The name Fishbone diagram was given due to its shape that with little imagination looks like the section view of a fish skeleton. This allows the designers or managers to outline the different activities taken in a process, and visualizes where Quality Control (QC) issues might arise, and determines what kind of resources are required at specific moments during the development.
Ishikawa diagrams became popular in the 1960’s by Kaoru Ishikawa. He is considered to be the pioneer of Quality Management processes in the Kawasaki shipyards, and became one of the founding fathers of modern management as we know it today. However, the basic concept of cause-and-effect analysis was first used in the 1920s’, considered one of the seven basic instruments to perform Quality Control.
Advantages of working with Fishbone diagram:
- Quickly identifies root-cause multiple times in the same or different causal tree
- Highly visual brainstorming instrument, leads to synergy of the brainstorm group that can detect further examples of root causes
- Allows to see in 1 overview all relevant causes simultaneously
- Perfect visualization tool to present summaries for top management and stakeholders for presenting issues
Disadvantages
- Interrelationships or correlations between causes are not easily identifiable
- No weight can be allocated to complex defects that might yield a lot of causes which might become visually cluttering
Adequate communication is essential in projects, in order to have truthful and accurate information exchange in order to ensure program managers or project managers are able to do rationally and correct decision making. For those individuals, who make the biggest impacts, have, what we call, a "high-performance mindset” and are always working with the latest update of professional project management templates to achieve their goals faster!
The Herringbone diagram is created by Kaoru Ishikawa, and this diagram is also known as:
- Ishikawa diagram;
- Fishbone Diagram;
- Cause-and-effect diagram;
- Fishikawa diagram;
- Root-cause analysis;
- Cause-effect analysis;
The Herringbone Diagram is commonly used for product design purposes or quality defect prevention to identify potential factors causing an overall effect.
Each cause or reason for imperfection is a source of variation. Causes are usually grouped into major categories to identify and classify these sources of variation. It will help you achieve your goals by visualizing the important target and the supportive goals.
Feel free to download this Herringbone Diagram template, that guarantees that you will save time, cost and efforts and enables you to reach the next level of success in your project, work and business!
Download this Herringbone Diagram template and make your analysis now.
DISCLAIMER
Nothing on this site shall be considered legal advice and no attorney-client relationship is established.
发表评论。 如果您有任何问题或意见,请随时在下面发布
Sponsored Link