Gantt Chart Weekly Spreadsheet
Opslaan, invullen, afdrukken, klaar!
How do you make a Weekly Gantt Chart in Excel? Looking for a template for a Weekly Gantt Chart spreadsheet? We have a sample template that can help you create a Gantt Chart quickly and efficiently
Beschikbare bestandsformaten:
.xls- Gevalideerd door een professional
- 100% aanpasbaar
- Taal: English
- Digitale download (169.5 kB)
- Na betaling ontvangt u direct de download link
- We raden aan dit bestand op uw computer te downloaden.

Zakelijk Gantt diagram Project management Gantt diagram Excel Taak Grafieken Project Gantt diagram Excel
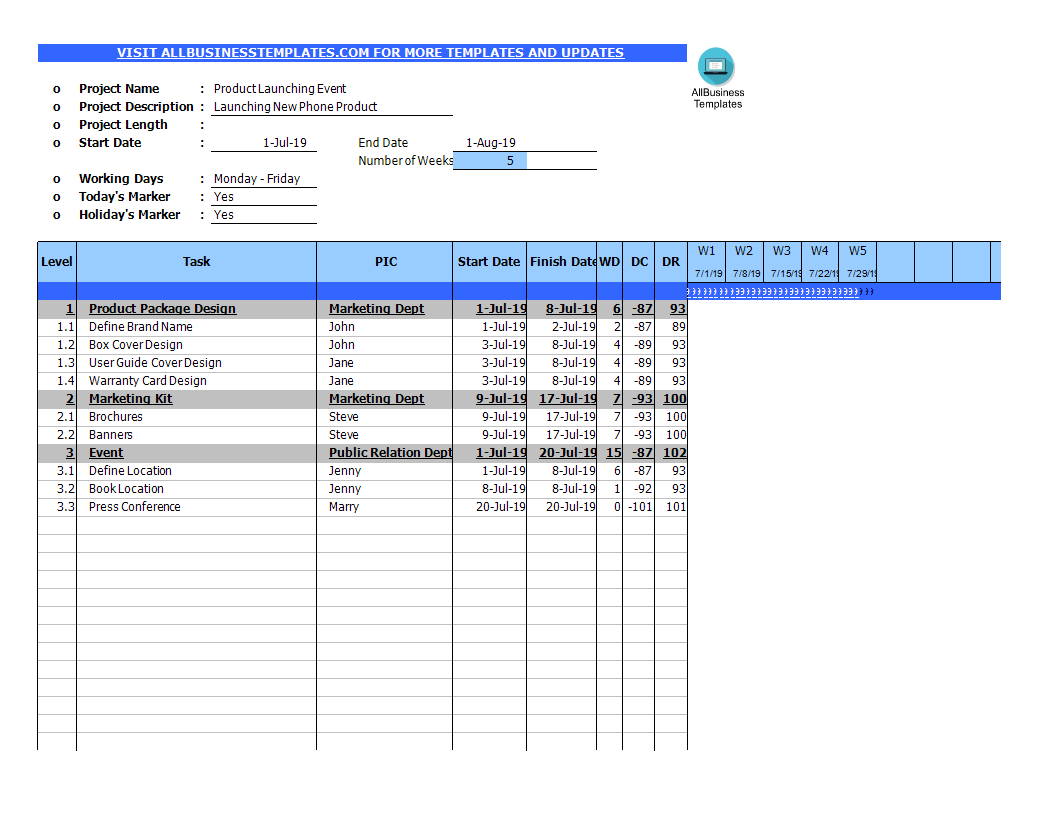
How do you make a Weekly Gantt Chart in Excel? Looking for a template for a Weekly Gantt Chart spreadsheet? We have a sample template that can help you create a Gantt Chart quickly and efficiently. Our templates are easy to use and can be customized to fit your needs An easy way to create your spreadsheet is by downloading this example template now!
What Is a Gantt Chart?
The Gantt chart is one of the most popular scheduling tools in project management. It’s a horizontal bar chart that shows progress on a project schedule.
Tasks are arrayed on the vertical axis while the horizontal axis represents time. Tasks may be rolled up into summary elements, which constitutes a number of subtasks and represents a phase of project work.
What are the Key Benefits of Using a Gantt Chart?
The charts are popular because they pack a large amount of information into an easily understandable, intuitive, and widely accessible format. They provide a clear view of project status and can even be used as a workable substitute for the project’s master schedule since they can contain everything you need to know about project tasks, resource requirements, and task dependencies. Even for people who aren’t trained as project managers, Gantt charts make it easy to understand how and when project tasks flow into each other. Here are some additional benefits of using Gantt charts:
- Promote detailed planning. Simply listing tasks forces project managers to break work down into chunks and understanding task dependencies requires granular knowledge of how a project is meant to proceed. Pinning down expected completion dates lead project teams to think carefully about resource requirements.
- Help to visualize the project schedule. A project’s critical path is the longest continuous sequence of tasks that effectively determines the duration of a project.
- Surface potential resource risks. On a technical level, Gantt charts help avoid resource overload, provide a basis for schedule accountability, and help identify where cost and duration can be reduced. Further, these charts can help identify potential problems such as if resources have been double-assigned, where staff are overscheduled, and when delays might affect the critical path.
- Improve project communications. On a human level, Gantt charts simplify the process of communicating the project plan and help keep everyone on the same page with little effort. They make the project’s planned progress easy for team members to visualize, providing both clarity and motivation to meet deadlines.
There are also advanced use cases for Gantt charts, outside of run-of-the-mill planning and scheduling. These scenarios include the following:
- Allocating resources across multiple simultaneous projects
- Planning iterations for software development sprints
- Comparing planned versus actual timelines on a project
Our Excel templates are grid-based files designed to organize information and perform calculations with scalable entries. Beginners and professionals from all over the world are now using spreadsheets to create tables, calculations, comparisons, overviews, etc for any personal or business need.
This Excel template is a great way to increase your productivity and performance. It gives you access to do remarkable new things with Excel, even if you only have a basic understanding of working with formula’s and spreadsheets. If time or quality is of the essence, this ready-made presentation can certainly help you out!
Download this Gantt Chart Weekly Spreadsheet now!
DISCLAIMER
Hoewel all content met de grootste zorg is gecreërd, kan niets op deze pagina direct worden aangenomen als juridisch advies, noch is er een advocaat-client relatie van toepassing.
Laat een antwoord achter. Als u nog vragen of opmerkingen hebt, kunt u deze hieronder plaatsen.


