Root Cause Analyse of Fishbone Diagram


root cause analysis or fishbone diagram voorbeeld afbeelding
Klik op de afbeelding om in te zoomen

Opslaan, invullen, afdrukken, klaar!
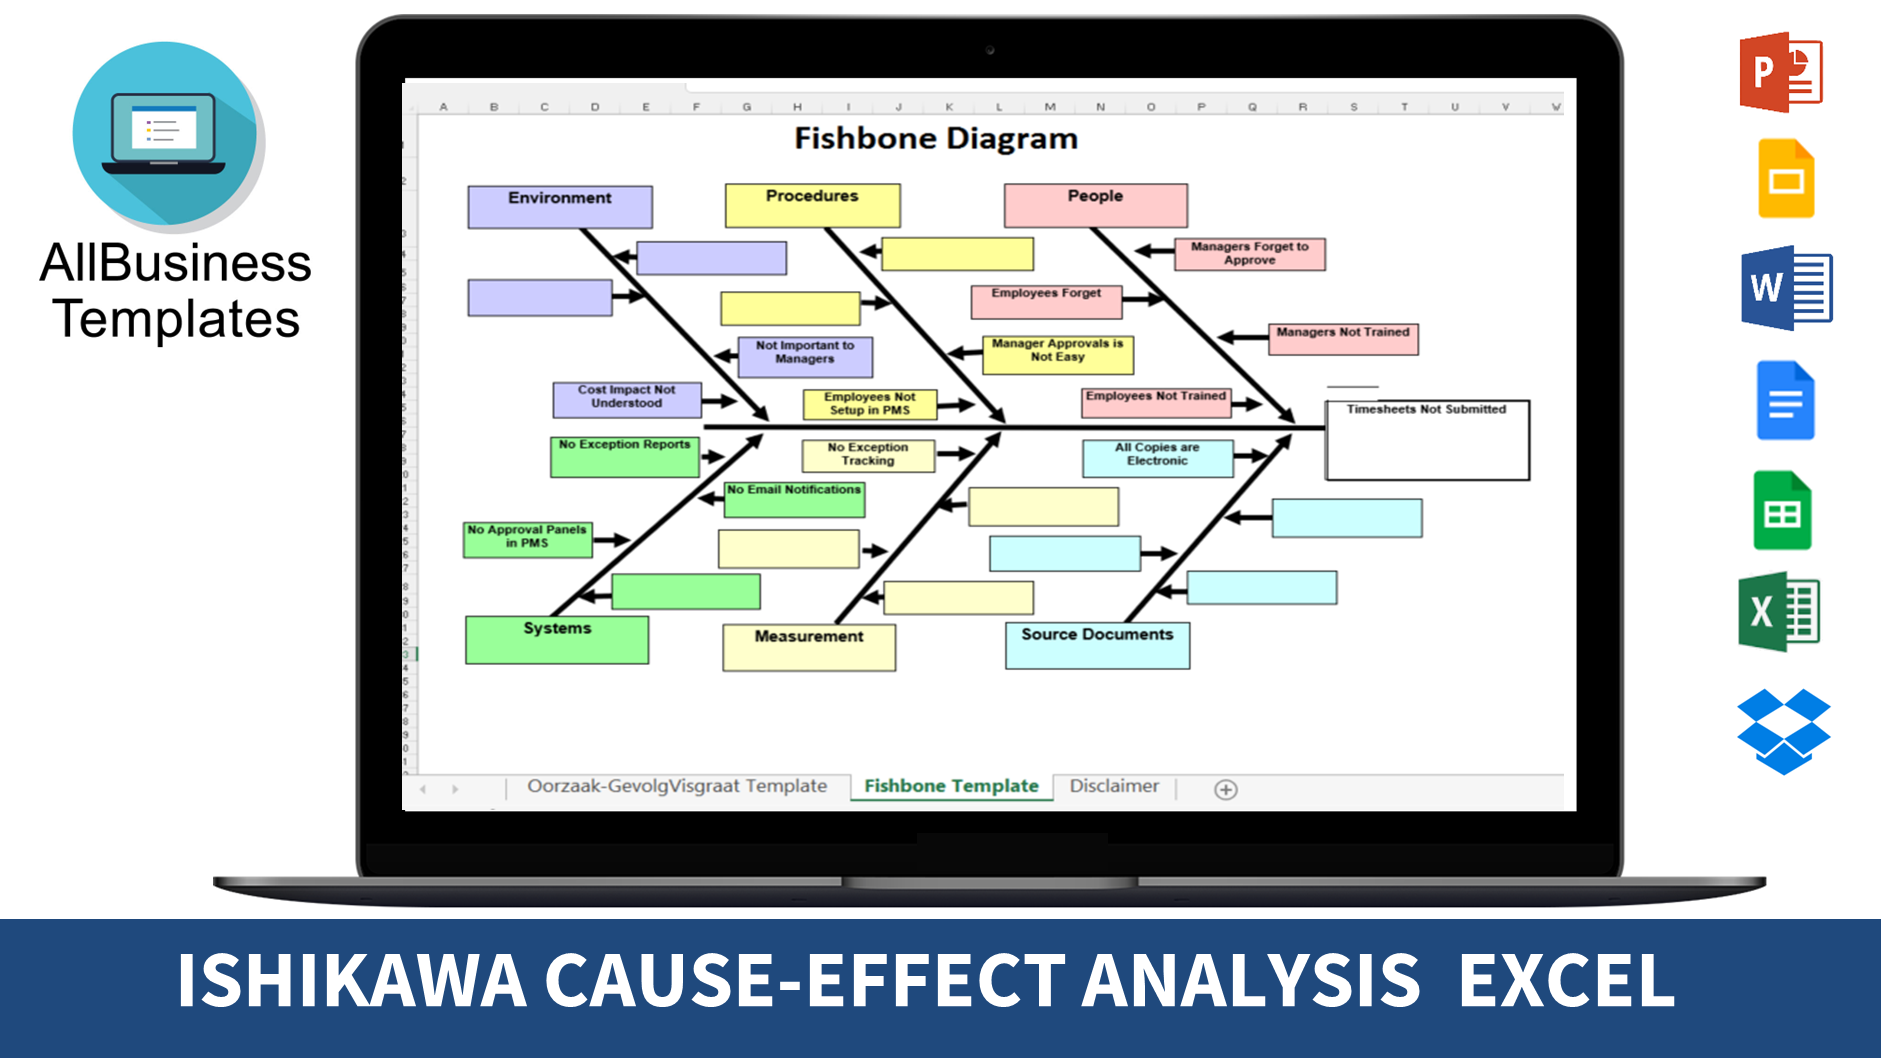
De beste manier om een Root Cause Analyse of Fishbone Diagram te maken? Check direct dit professionele Root Cause Analyse of Fishbone Diagram template!


Beschikbare bestandsformaten:

.xls


Template in andere talen beschikbaar:

  • Gevalideerd door een professional
  • 100% aanpasbaar
  • Taal: English
  • Digitale download (203.5 kB)
  • Na betaling ontvangt u direct de download link
  • We raden aan dit bestand op uw computer te downloaden.


ABT beoordeling: 7

Malware en virus vrij: Norton safe website


Zakelijk Financiën Project management visgraatdiagram visgraat tijdlijn informatie Technologie Technologie Beheer van informatietechnologie Analyse Mensen Analyse van bronoorzaken analyse van de oorzaak van de oorzaak oorzaak visgraat of worteloorzaak analyse van de worteloorzaak of visgraatdiagram excel root oorzaak visgraat diagram visgraatdiagram sjabloon Excel tijdlijndiagram tijdlijn voorbeeld

How to create a Root-Cause Fishbone Diagram in Excel? Do you need a Root Cause Analysis or Fishbone Diagram? Download this professional Fishbone Diagram template now! 

An Ishikawa diagram (also known as Fishbone diagram, herringbone diagram, Cause-Effect diagram) is an overview that visualizes the causes of an effect or event and is often used in manufacturing and product development. The name Fishbone diagram was given due to its shape that with little imagination looks like the section view of a fish skeleton. This allows the designers or managers to outline the different activities taken in a process, and visualizes where Quality Control (QC) issues might arise, and determines what kind of resources are required at specific moments during the development.

Ishikawa diagrams became popular in the 1960’s by Kaoru Ishikawa. He is considered to be the pioneer of Quality Management processes in the Kawasaki shipyards, and became one of the founding fathers of modern management as we know it today. However, the basic concept of cause-and-effect analysis was first used in the 1920s’, considered one of the seven basic instruments to perform Quality Control. 

Advantages of working with Fishbone diagram:

  • Quickly identifies root-cause multiple times in the same or different causal tree
  • Highly visual brainstorming instrument, leads to synergy of the brainstorm group that can detect further examples of root causes
  • Allows to see in 1 overview all relevant causes simultaneously
  • Perfect visualization tool to present summaries for top management and stakeholders for presenting issues

Disadvantages

  • Interrelationships or correlations between causes are not easily identifiable
  • No weight can be allocated to complex defects that might yield a lot of causes which might become visually cluttering

Adequate communication is essential in projects, in order to have truthful and accurate information exchange in order to ensure program managers or project managers are able to do rationally and correct decision making. For those individuals, who make the biggest impacts, have, what we call, a "high-performance mindset” and are always working with the latest update of professional project management templates to achieve their goals faster!

The Cause-effect analysis diagram is created by Kaoru Ishikawa, and this diagram is also known as:

  • Ishikawa diagram;
  • Fishbone diagram;
  • Herringbone diagram;
  • Cause-and-effect diagram;
  • Fishikawa diagram;
  • Root-cause analysis.

Excel is not the most easy way to make an Ishikawa Diagram, but it allows for easy calculations or easy ways to fill in the fields. This Excel Fishbone Diagram is commonly used for product design purposes or quality defect prevention to identify potential factors causing an overall effect. Each cause or reason for imperfection is a source of variation. Causes are usually grouped into major categories to identify and classify these sources of variation. It will help you achieve your goals by visualizing the important target and the supportive goals. The issue or defect is shown as the fish's head, facing to the east, with the causes extending to the left as fish bones; the ribs branch off the backbone for major causes, with sub-branches for root-causes, to as many levels as required.

This ready-made and easy-to-customize Excel  Fishbone Diagram template is well suited for any kind of personalized business matter. Communicating in a professional way will get you and your company respect and will bring you further in life and business. Using our ready to use and easy to modify Fishbone Diagram brings you an extra motivation and inspiration and gives you more time to focus on important subjects in your personalized file.


We support you by providing this Fishbone Diagram template, which will save you time, cost and efforts and help you to reach the next level of success in your career and business! 

Download this Root Cause Analysis or Fishbone Diagram template now and enhance your business!


Do you need more information? AllBusinessTemplates.com provides many kinds of legal and business templates in the range from IT, Environmental, Startups, Marketing, Sales, Procurement, Law, Notary, Finance, HR, Auction, Logistics, Transportation, Maintenance Services, etc. Just search on our website and have instant access to thousands of free and premium business document templates, forms, letters, reports, plans, resumes used by professionals in your industry. All business templates are easy to find, crafted by professionals, ready to use, easy to customize and intuitive.


DISCLAIMER
Hoewel all content met de grootste zorg is gecreërd, kan niets op deze pagina direct worden aangenomen als juridisch advies, noch is er een advocaat-client relatie van toepassing.


Laat een antwoord achter. Als u nog vragen of opmerkingen hebt, kunt u deze hieronder plaatsen.


default user img

Gerelateerde templates