Grafiek Excel
Opslaan, invullen, afdrukken, klaar!
De beste manier om een Grafiek Excel te maken? Check direct dit professionele Grafiek Excel template!
Beschikbare bestandsformaten:
.pdf- Gevalideerd door een professional
- 100% aanpasbaar
- Taal: English
- Digitale download (161.24 kB)
- Na betaling ontvangt u direct de download link
- We raden aan dit bestand op uw computer te downloaden.

Zakelijk diagram gegevens Grafieken As Hiërarchiekaart
How to draft a Chart Excel? An easy way to start completing your document is to download this Chart Excel template now!
Every day brings new projects, emails, documents, and task lists, and often it is not that different from the work you have done before. Many of our day-to-day tasks are similar to something we have done before. Don't reinvent the wheel every time you start to work on something new!
Instead, we provide this standardized Chart Excel template with text and formatting as a starting point to help professionalize the way you are working. Our private, business and legal document templates are regularly screened by professionals. If time or quality is of the essence, this ready-made template can help you to save time and to focus on the topics that really matter!
Using this document template guarantees you will save time, cost and efforts! It comes in Microsoft Office format, is ready to be tailored to your personal needs. Completing your document has never been easier!
Download this Chart Excel template now for your own benefit!
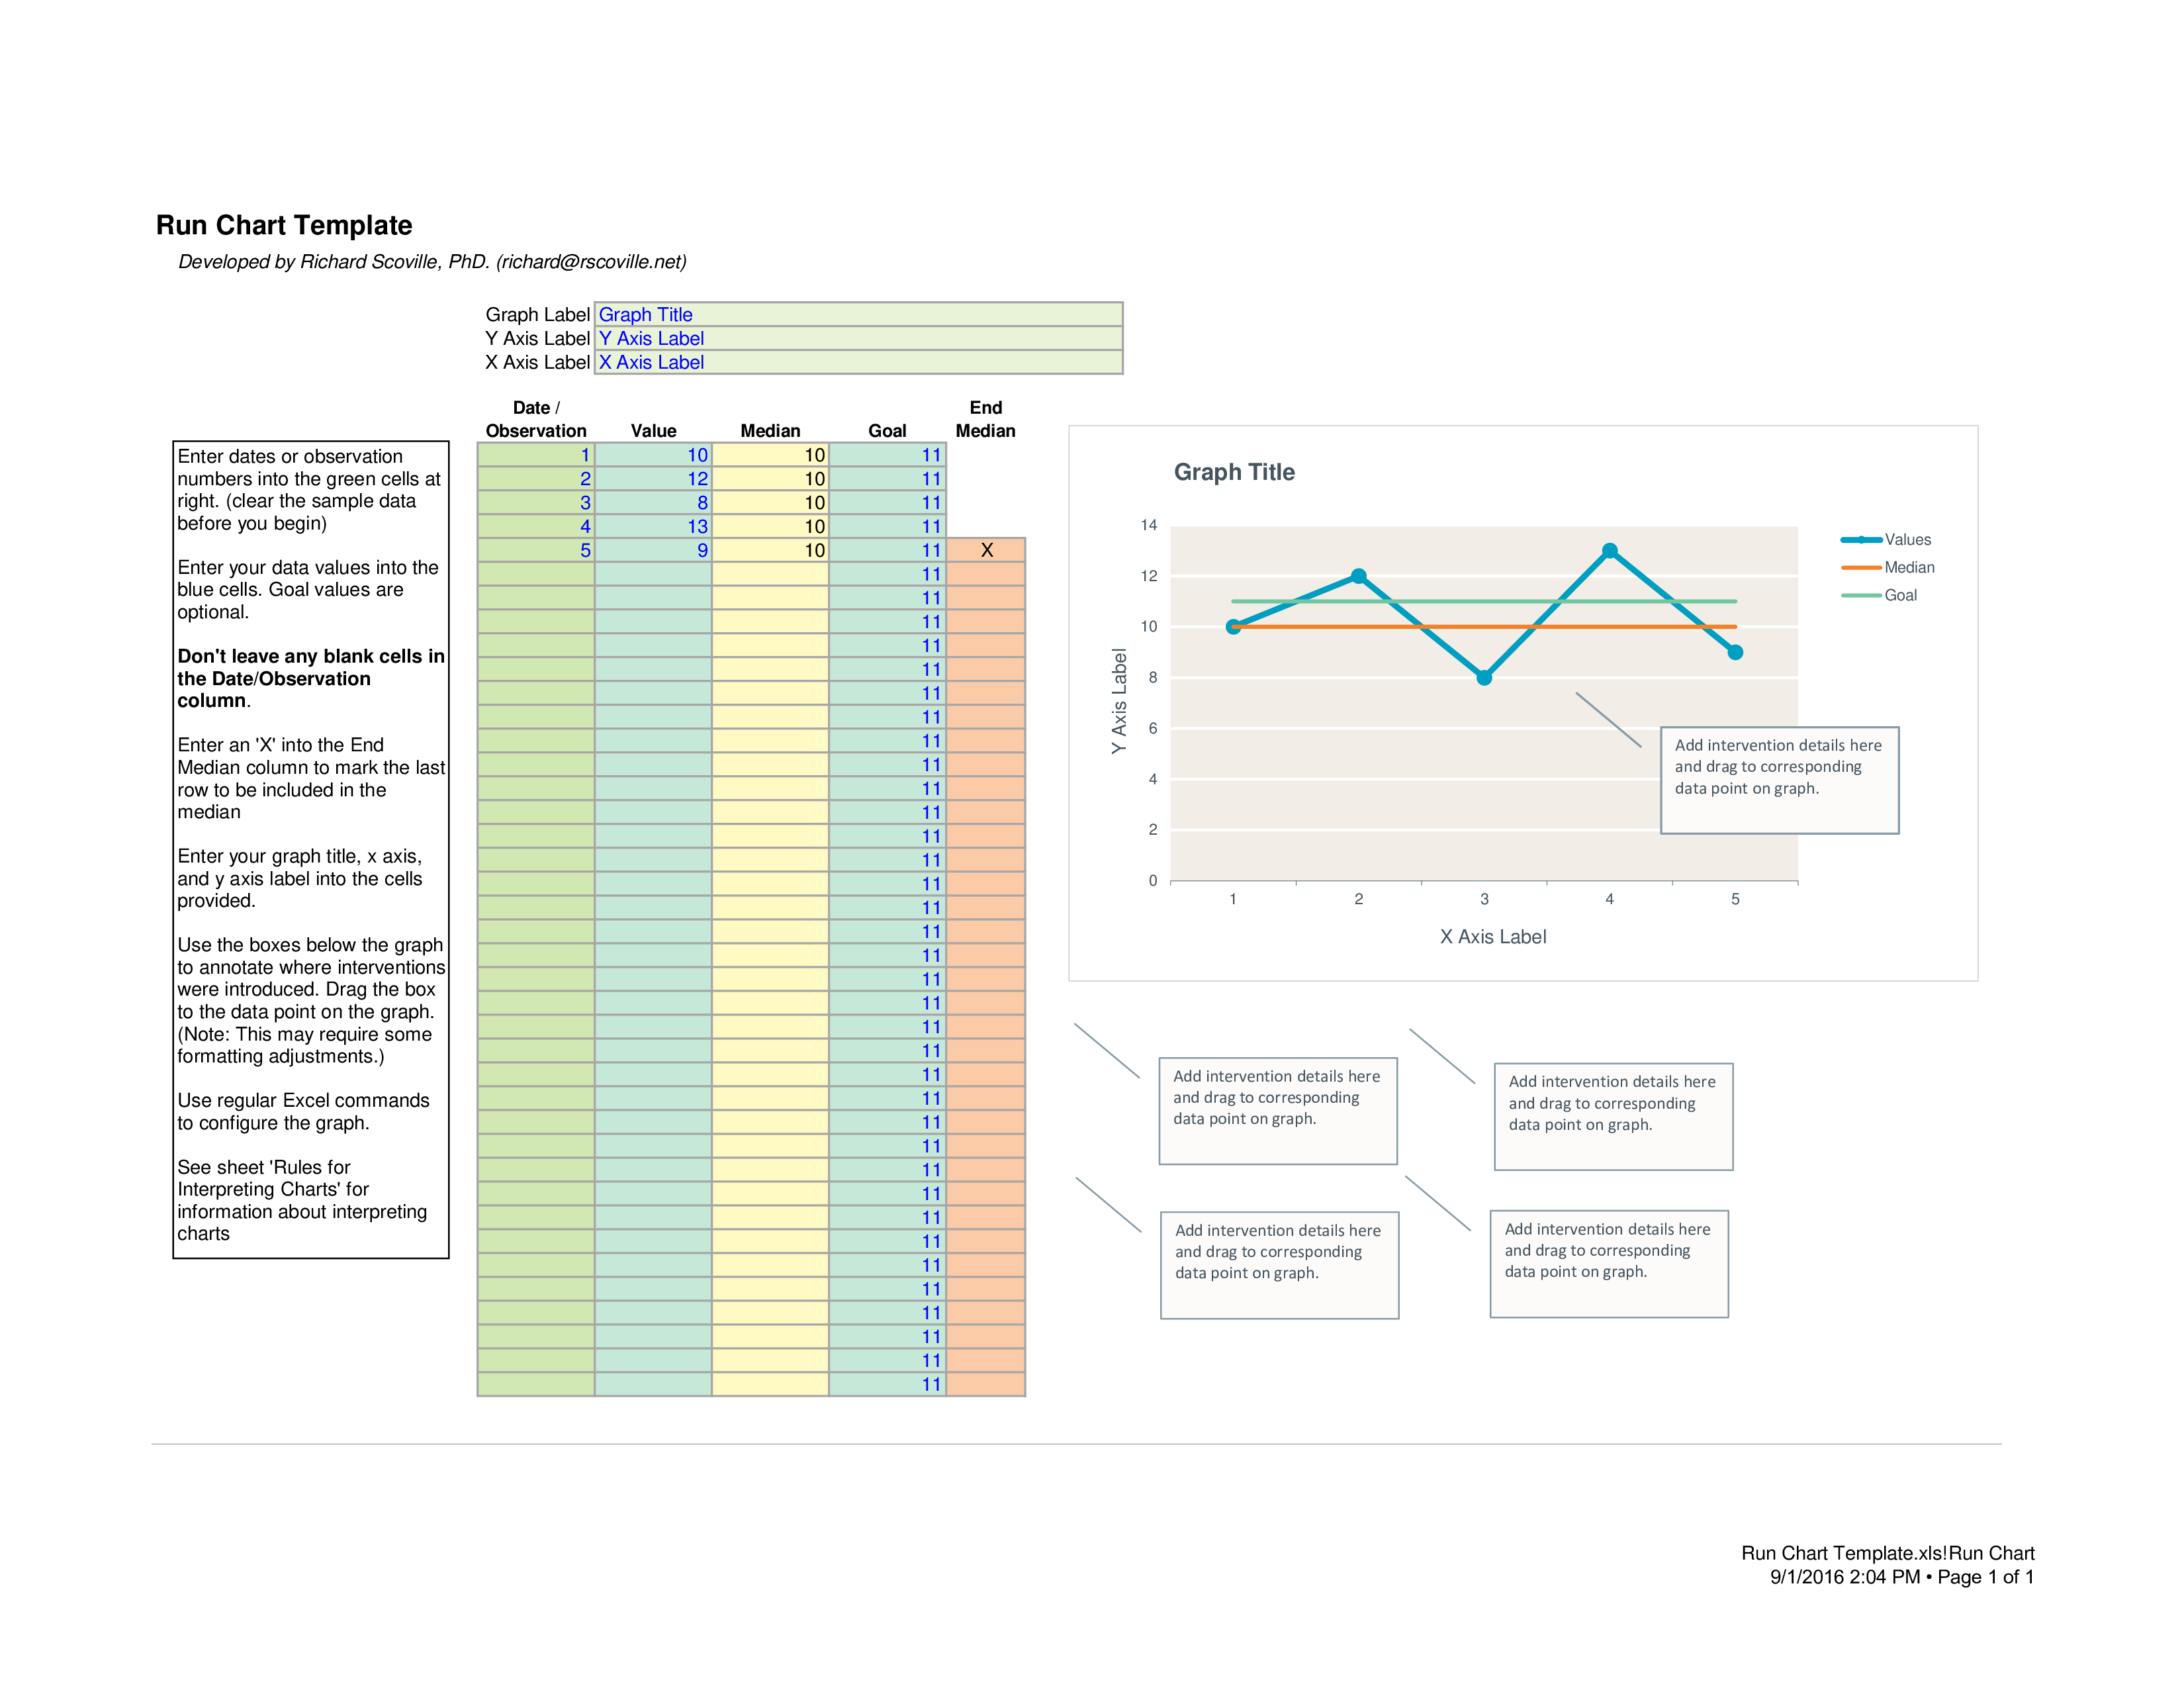
See sheet Rules for Interpreting Charts for information about interpreting charts 1 2 3 4 5 Value Median 10 12 8 13 9 End Median Goal 10 10 10 10 10 10 10 10 10 10 10 10 10 10 10 10 10 10 10 10 10 10 10 10 10 10 10 10 10 10 10 10 10 10 10 10 10 10 10 10 11 11 11 11 11 11 11 11 11 11 11 11 11 11 11 11 11 11 11 11 11 11 11 11 11 11 11 11 11 11 11 11 11 11 11 11 11 11 11 11 Graph Title 14 Values X Median 12 Goal 10 Y Axis Label Date / Observation 8 6 Add intervention details here and drag to corresponding data point on graph..
DISCLAIMER
Hoewel all content met de grootste zorg is gecreërd, kan niets op deze pagina direct worden aangenomen als juridisch advies, noch is er een advocaat-client relatie van toepassing.
Laat een antwoord achter. Als u nog vragen of opmerkingen hebt, kunt u deze hieronder plaatsen.


