Timeline Gantt Chart Excel
Sponsored Link免费模板 保存,填空,打印,三步搞定!

Download Timeline Gantt Chart Excel
微软电子表格 (.xlsx)- 本文档已通过专业认证
- 100%可定制
- 这是一个数字下载 (15.05 kB)
- 语: English
Sponsored Link

How to make a professional Timeline Gantt Chart Excel? Would you like to create a Timeline Gantt Chart in Excel? The template should include a project title, start and end dates, tasks, resources, and milestones. It should also include a timeline bar chart to visualize the project's progress. Finally, it should provide a status report to show the project's current status. Download this sample chart template now!
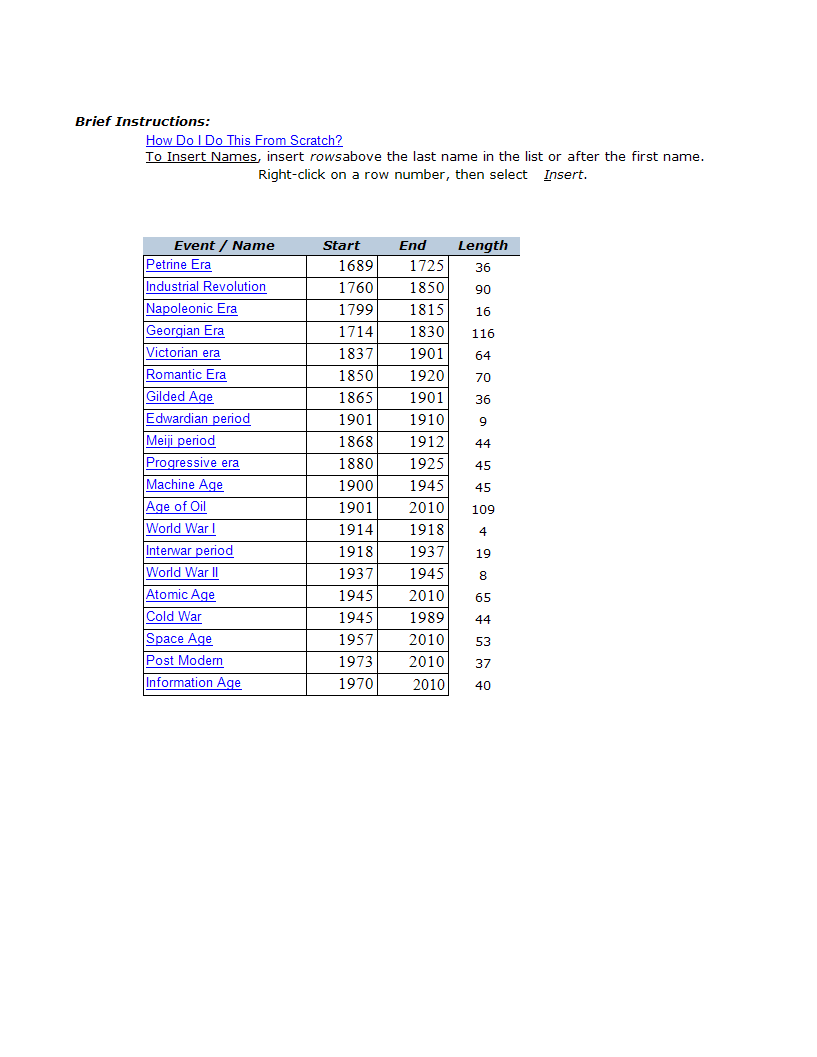
A Timeline Gantt Chart is a type of bar chart that represents a project schedule over time. It provides a visual representation of tasks or activities and their corresponding start and end dates within a project.
Creating a Gantt Chart in Excel is a straightforward process that involves using a stacked bar chart and customizing it to represent your project timeline. Here's a step-by-step guide:
- Data Preparation:
- Open Microsoft Excel and create a new worksheet.
- Set up your data with the following columns: Task Name, Start Date, Duration.
- Insert a Stacked Bar Chart:
- Highlight your data, including the headers.
- Go to the "Insert" tab on the Ribbon.
- Click on "Bar Chart" and select "Stacked Bar."
- Format the Chart:
- Your chart may look like a simple bar chart at this point. Right-click on the chart and choose "Select Data."
- Click "Add" to add a new series. For the "Series values," select your "Start Date" column. For the "Category axis labels," choose your "Task Name" column.
- Now, you should have two series in your chart. Click "OK" to close the "Select Data Source" window.
- Adjust Dates:
- Your chart might not display dates on the horizontal axis correctly. Right-click on the horizontal axis and select "Format Axis."
- Under the "Axis Options" tab, set the "Minimum" bound to your project start date and the "Maximum" bound to your project end date. Adjust other options as needed.
- Format the Bars:
- Format the bars to represent the duration of each task. Click on one of the bars, right-click, and choose "Format Data Series."
- In the "Format Data Series" pane, adjust the "Gap Width" to make the bars wider or narrower.
- You can also change the bar color to make the chart more visually appealing.
- Add Milestones (Optional):
- If you have important milestones in your project, you can add them to the Gantt Chart. Simply insert another series for milestone dates and format them differently, for example, using a different color or marker style.
- Final Touches:
- Add axis titles, a chart title, and any other labels to make your Gantt Chart more informative.
- Customize the legend and any other chart elements as needed.
Remember, Gantt Charts in Excel can be a bit manual, and you might need to adjust the chart as your project progresses. Additionally, there are dedicated project management tools that offer more advanced Gantt Chart features and automation.
Feel free to download this Timeline Gantt Chart Excel, or simply browse through our other basic or advanced template designs. They are intuitive and in several kinds of formats, such as: PDF, WORD, XLS (EXCEL including formulas and can calculate sums automatically), etc.
Using this project management template guarantees that you will save time, cost and efforts and makes you more successful in your project, work and business!
Completing your project management Timeline Gantt Chart Excel was never simpler! Download it now!
DISCLAIMER
Nothing on this site shall be considered legal advice and no attorney-client relationship is established.
发表评论。 如果您有任何问题或意见,请随时在下面发布


Sponsored Link