Timeline Gantt Chart Excel
I-Save, punan ang mga blanko, i-printa, Tapos na!
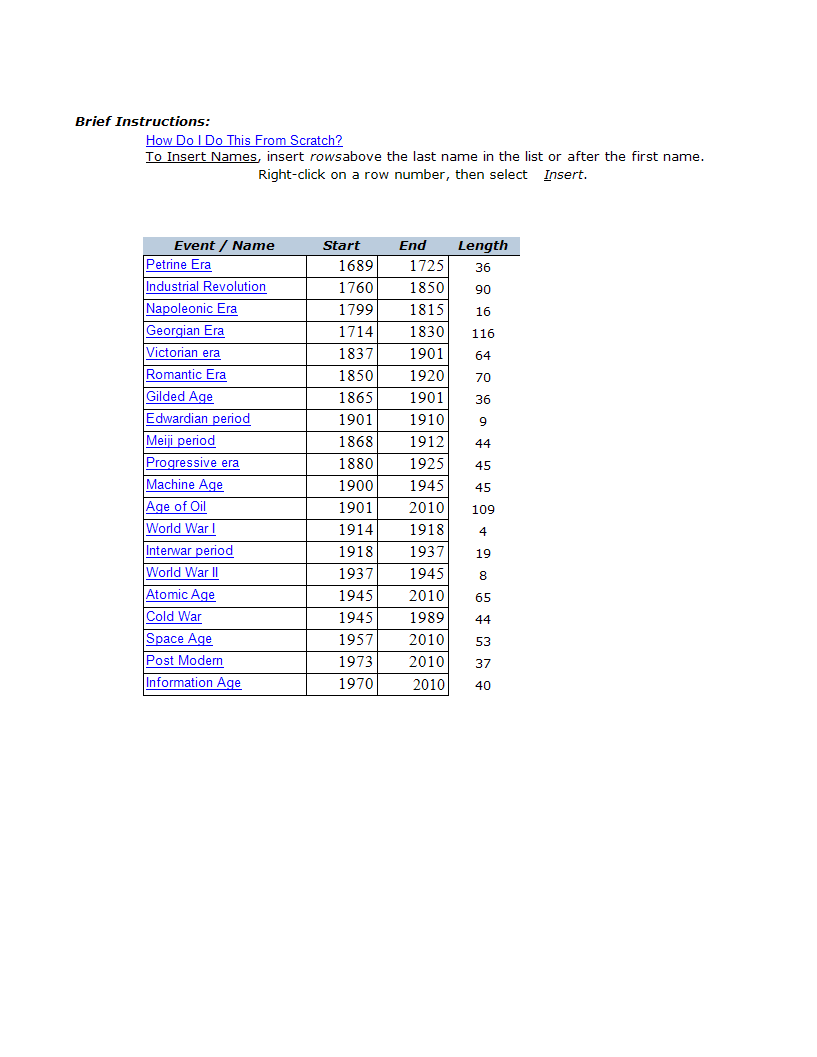
How to make a professional Timeline Gantt Chart? Would you like to create a timeline Gantt chart in Excel? Download this Timeline Gantt Chart template now which is created in an Excel format!
Mga magagamit na premium na format ng file:
.xlsx- Itong dokumento ay sertipikado ng isang Propesyonal
- 100% pwedeng i-customize

Business Negosyo gantt chart Projectmanagement Proyekto ng Pagkontrol Excel Gantt chart Excel Excel ng Gantt chart Name Period Insert War Era Excel template excel templates Excel templates for business
- Data Preparation:
- Open Microsoft Excel and create a new worksheet.
- Set up your data with the following columns: Task Name, Start Date, Duration.
- Insert a Stacked Bar Chart:
- Highlight your data, including the headers.
- Go to the "Insert" tab on the Ribbon.
- Click on "Bar Chart" and select "Stacked Bar."
- Format the Chart:
- Your chart may look like a simple bar chart at this point. Right-click on the chart and choose "Select Data."
- Click "Add" to add a new series. For the "Series values," select your "Start Date" column. For the "Category axis labels," choose your "Task Name" column.
- Now, you should have two series in your chart. Click "OK" to close the "Select Data Source" window.
- Adjust Dates:
- Your chart might not display dates on the horizontal axis correctly. Right-click on the horizontal axis and select "Format Axis."
- Under the "Axis Options" tab, set the "Minimum" bound to your project start date and the "Maximum" bound to your project end date. Adjust other options as needed.
- Format the Bars:
- Format the bars to represent the duration of each task. Click on one of the bars, right-click, and choose "Format Data Series."
- In the "Format Data Series" pane, adjust the "Gap Width" to make the bars wider or narrower.
- You can also change the bar color to make the chart more visually appealing.
- Add Milestones (Optional):
- If you have important milestones in your project, you can add them to the Gantt Chart. Simply insert another series for milestone dates and format them differently, for example, using a different color or marker style.
- Final Touches:
- Add axis titles, a chart title, and any other labels to make your Gantt Chart more informative.
- Customize the legend and any other chart elements as needed.
Feel free to download this Timeline Gantt Chart Excel, or simply browse through our other basic or advanced template designs. They are intuitive and in several kinds of formats, such as: PDF, WORD, XLS (EXCEL including formulas and can calculate sums automatically), etc.
Using this project management template guarantees that you will save time, cost and efforts and makes you more successful in your project, work and business!
Completing your project management Timeline Gantt Chart Excel was never simpler! Download it now!
DISCLAIMER
Wala sa 'site' na ito ang dapat ituring na legal na payo at walang abogado-kliyenteng relasyon na itinatag.
Mag-iwan ng tugon. Kung mayroon kang anumang mga katanungan o mga komento, maaari mong ilagay ang mga ito sa ibaba.


