Excel Dashboard Report
Sponsored Link免费模板 保存,填空,打印,三步搞定!

Download Excel Dashboard Report
微软电子表格 (.xls)免费文件转换
- 本文档已通过专业认证
- 100%可定制
- 这是一个数字下载 (24.5 kB)
- 语: English
Sponsored Link

How to create a Excel Dashboard Report? An easy way to start completing your document is to download this example Excel Dashboard Report template now!
We provide this Excel Dashboard Report template to help professionalize the way you are working. Our business and legal templates are regularly screened and used by professionals. If time or quality is of the essence, this ready-made template can help you to save time and to focus on the topics that really matter!
Using this Excel Dashboard Report template guarantees you will save time, cost and efforts! Completing documents has never been easier!
Download this Excel Dashboard Report template now for your own benefit!
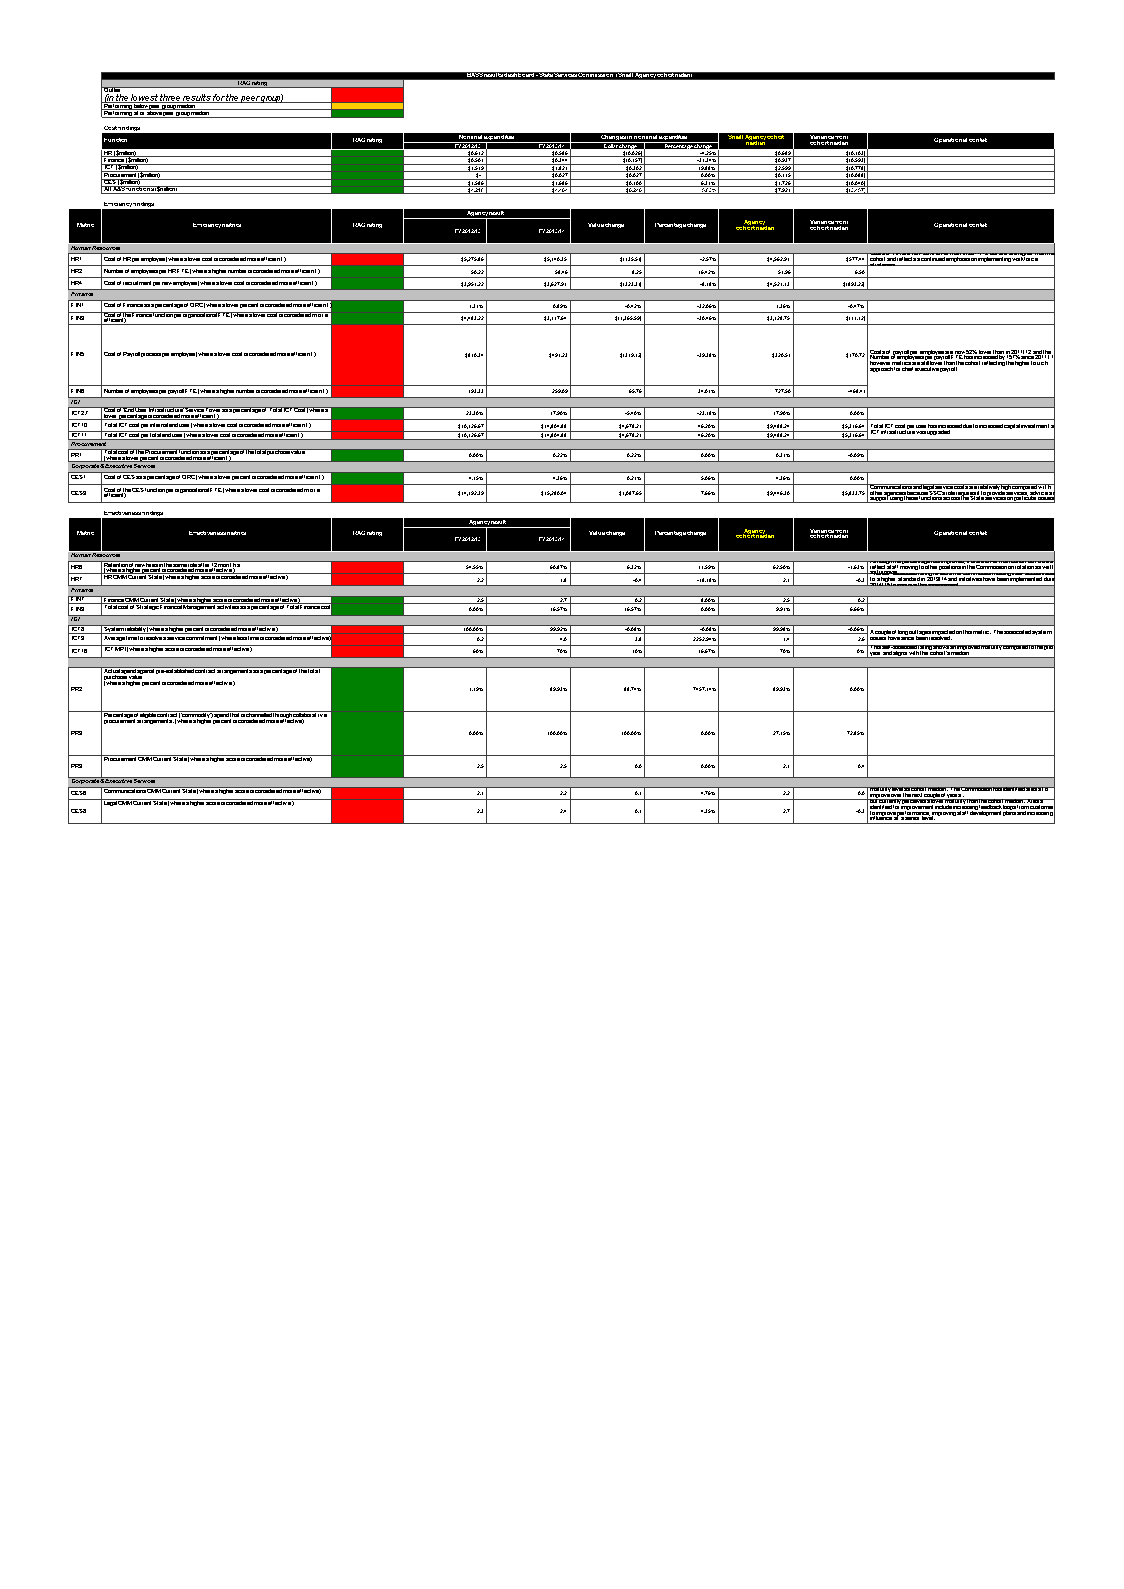
,BASS results dashboard - State Services Commission (Small Agency cohort median),,,, ,RAG rating,,,, ,"Outlier (in the lowest three results for the peer group)",,,, ,Performing below peer group median,,,, ,Performing at or above peer group median,,,, ,,,,, ,Cost findings,,,, ,Function,RAG rating,Nominal expenditure,Changes in nominal expenditure,Small Agency cohort median,"Variance from cohort median ",Operational context ,,FY 2012/13 ,FY 2013/14 ,Dollar change ,Percentage change,, ,HR ( million),"0,612","0,586","-0,026","-4,2483660130719 ","0,689","-0,103", ,Finance ( million),"0,501","0,344","-0,157","-31,3373253493014 ","0,937","-0,593", ,ICT ( million),"1,519","1,821","0,302","19,8815009874918 ","2,599","-0,778", ,Procurement ( million),0,"0,027","0,027",0 ,"0,115","-0,088", ,CES ( million),"1,586","1,686","0,0999999999999999","6,30517023959646 ","1,726","-0,04", ,All A S functions ( million),"4,218","4,464","0,246","5,83214793741111 ","7,921","-3,457", ,,,,, ,Efficiency findings,,,, Metric,Efficiency metrics,RAG rating,Agency result ,Value change ,Percentage change ,"Agency cohort median ","Variance from cohort median ",Operational context ,,FY 2012/13 ,FY 2013/14 ,,Small Agency cohort median, Human Resources,,,,, HR1,Cost of HR per employee (where a lower cost is considered more efficient),"5275,8621","5140,3509","-135,5112","-2,56851292606757 ","4562,9139","577,437000000001",Costs of HR are now 26 lower than in 2011/12 but are still higher than the cohort and reflects a continued emphasis on implementing workforce strategies HR2,Number of employees per HR FTE (where a higher number is considered more efficient),"50,2165","58,4615","8,245","16,4189061364293 ","51,9643","6,4972", HR4,Cost of recruitment per new employee (where a lower cost is considered more efficient),"3951,2195","3627,907","-323,3125","-8,18260033389691 ","4521,1268","-893,2198", Finance,,,,, FIN1,Cost of Finance as a percentage of
DISCLAIMER
Nothing on this site shall be considered legal advice and no attorney-client relationship is established.
发表评论。 如果您有任何问题或意见,请随时在下面发布
相关文件


Sponsored Link