Project Gantt Chart in Excel
Speichern, ausfüllen, drucken, fertig!
How to make a professional Project Gantt Chart Excel? Do you require a template for a Project Gantt Chart in Excel? Download this sample template now which is designed to help you visualize and manage your project's timeline.
Verfügbare Gratis-Dateiformate:
.xlsWeitere verfügbare Sprachen:
- Dieses Dokument wurde von einem Professional zertifiziert
- 100% anpassbar

Business Unternehmen gantt chart Gantt Diagramm Projectmanagement Projektmanagement gantt Gantt goal Tor initial Initiale Gantt chart Excel Excel Gantt Diagramm gantt diagram Gantt Diagramm wat is een gantt diagram wat ist ein gantt Diagramm excel gantt diagram Excel Gantt Diagramm Chart Diagramm Sub Task Aufgabe excel gantt chart Excel Gantt Diagramm Charts Diagramme Printable Chart Templates To Download Druckbare Diagrammvorlagen zum Herunterladen Project Gantt Chart Excel Projekt Gantt Diagramm Excel Project Gantt Chart Excel Example Excel Beispiel für ein Gantt Diagramm für ein Projekt Project Gantt Chart Excel Sample Excel Beispiel für Gantt Diagramm von Projekten Gantt Chart Sample Gantt Diagramm Beispiel Project Gantt Chart Template Excel Xls Projekt Gantt Diagrammvorlage Excel Xls Project Gantt Chart Template Excel Projekt Gantt Diagrammvorlage Excel Aim Ziel Gantt Chart Example Gantt Diagramm Beispiel teamgantt Team Gantt microsoft project gantt chart best free gantt chart software gantt project planner gantt chart google sheets gantt charts gantt chart maker what is a gantt chart gantt diagram uitblinken gantt diagramsjabloon gantt diagrammen gantt grafiekmaker gantt diagram google bladen gantt diagram excel sjabloon voorbeeld van een gantt diagram
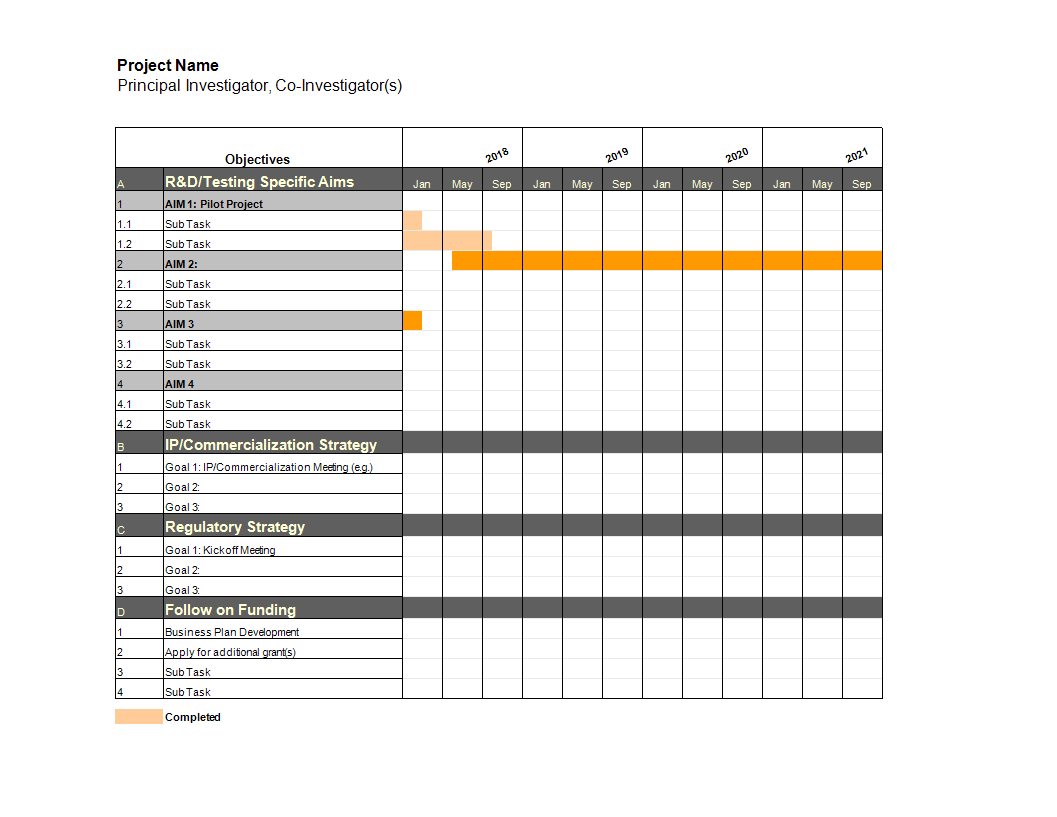
How to make a professional Project Gantt Chart Excel? Do you require a template for a Project Gantt Chart in Excel? This template is designed to help you visualize and manage your project's timeline. It includes columns for project tasks, start dates, end dates, and dependencies. Download this project management Project Gantt Chart Excel template now!
A Gantt chart is one of the most popular scheduling tools in project management. It’s a horizontal bar chart that shows progress on a project schedule. Tasks are arrayed on the vertical axis while the horizontal axis represents time. Tasks may be rolled up into summary elements, which constitutes a number of subtasks and represents a phase of project work.
What are the key benefits of using a Gantt Chart?
The charts are popular because they pack a large amount of information into an easily understandable, intuitive, and widely accessible format. They provide a clear view of project status and can even be used as a workable substitute for the project’s master schedule since they can contain everything you need to know about project tasks, resource requirements, and task dependencies. Even for people who aren’t trained as project managers, Gantt charts make it easy to understand how and when project tasks flow into each other. Here are some additional benefits of using Gantt charts:
- Promote detailed planning. Simply listing tasks forces project managers to break work down into chunks and understanding task dependencies requires granular knowledge of how a project is meant to proceed. Pinning down expected completion dates lead project teams to think carefully about resource requirements.
- Help to visualize the project schedule. A project’s critical path is the longest continuous sequence of tasks that effectively determines the duration of a project.
- Surface potential resource risks. On a technical level, Gantt charts help avoid resource overload, provide a basis for schedule accountability, and help identify where cost and duration can be reduced. Further, these charts can help identify potential problems such as if resources have been double-assigned, where staff are overscheduled, and when delays might affect the critical path.
- Improve project communications. On a human level, Gantt charts simplify the process of communicating the project plan and help keep everyone on the same page with little effort. They make the project’s planned progress easy for team members to visualize, providing both clarity and motivation to meet deadlines.
There are also advanced use cases for Gantt charts, outside of run-of-the-mill planning and scheduling. These scenarios include the following:
- Allocating resources across multiple simultaneous projects;
- Planning iterations for software development sprints;
- Comparing planned versus actual timelines on a project.
This spreadsheet is an interactive digital worksheet in tabular form and designed to organize information and perform calculations with scalable entries. It's not a matter of being a beginner or professional, from all over the world, are now using spreadsheets to create tables, calculations, comparisons, overviews, etc for any personal or business need. A Gantt chart is a very popular planning tool that is often used to manage projects and to provide to the management/project board a status update.
Often, such a planner chart tool consists of just four basic components, like:
- activity names (description of the task or activity);
- activity bars (the start date and lead time for the task or activity)
- milestones (milestone marks the end of a piece of work or phase of the project. They are often fixed dates with or important dates that you need to be aware);
- dependencies, overlap, and link with other activities. Activities that can only start and finish, or are directly impacted, if another task is finished before them. Therefore it’s common to add a number in the column This is often an easier way of quickly finding out which task links where. Use the numbers in this column to track back the task dependencies, it can be faster than trying to trace a spidery line on the Gantt chart.).
This useful planner worksheet will make all your tasks a little easier and can be used for organization, analysis, accounting, and storage of data in order to increase your productivity. This Gantt Chart Template in excel gives you a head start and is useful because it also has the basic formula’s included. If time and quality are of the essence, this worksheet can certainly help you out!
Feel free to download this Project Gantt Chart Excel, or simply browse through our other basic or advanced template designs. They are intuitive and in several kinds of formats, such as: PDF, WORD, XLS (EXCEL including formulas and can calculate sums automatically), etc.
Completing your project management Project Gantt Chart Excel was never easier! Download it now!
HAFTUNGSAUSSCHLUSS
Nichts auf dieser Website gilt als Rechtsberatung und kein Mandatsverhältnis wird hergestellt.
Wenn Sie Fragen oder Anmerkungen haben, können Sie sie gerne unten veröffentlichen.


