Control Chart Excel
Speichern, ausfüllen, drucken, fertig!
How to create a Control Chart in MS Excel? An easy way to make your chart is to download this example Control Chart Excel template now!
Preis: USD 2.99
Jetzt downloaden!
Verfügbare Premium-Dateiformate:
.xlsx- Dieses Dokument wurde von einem Professional zertifiziert
- 100% anpassbar
Business Unternehmen Finance Finanzen Education Bildung math Mathematik mathematics Mathematik Process Verarbeiten Chart Diagramm Bar Control Steuerung Control Chart Steuerkarte Charts Diagramme chart template Diagrammvorlage process capability chart Prozessfähigkeitsdiagramm spc tools excel run chart template statistical process control charts examples how to create a control chart in excel Plot Diagram Plot Diagramm dmaic monitoring plan six sigma one pager Six Sigma einseitig green belt control plan template Vorlage für einen Grüngürtel Kontrollplan lean six sigma project closure Lean Six Sigma Projektabschluss innovation transfer opportunities Möglichkeiten des Innovationstransfers visual management checklist how to calculate So berechnen Sie how to calculate control limits So berechnen Sie Eingriffsgrenzen i mr chart minitab capability analysis minitab capability analysis minitab standard deviation formula minitab control chart specification limit control charts cheat sheet 3 sigma p chart in excel make a p chart spc p chart excel download sample control control chart problems solutions Regelkarte für die Lösung von Problemen r chart calculator ucl formula control chart constants control limits are Eingriffsgrenzen sind quality control in r
How to create a Control Chart in MS Excel? An easy way to make your chart is to download this example Control Chart Excel template now!
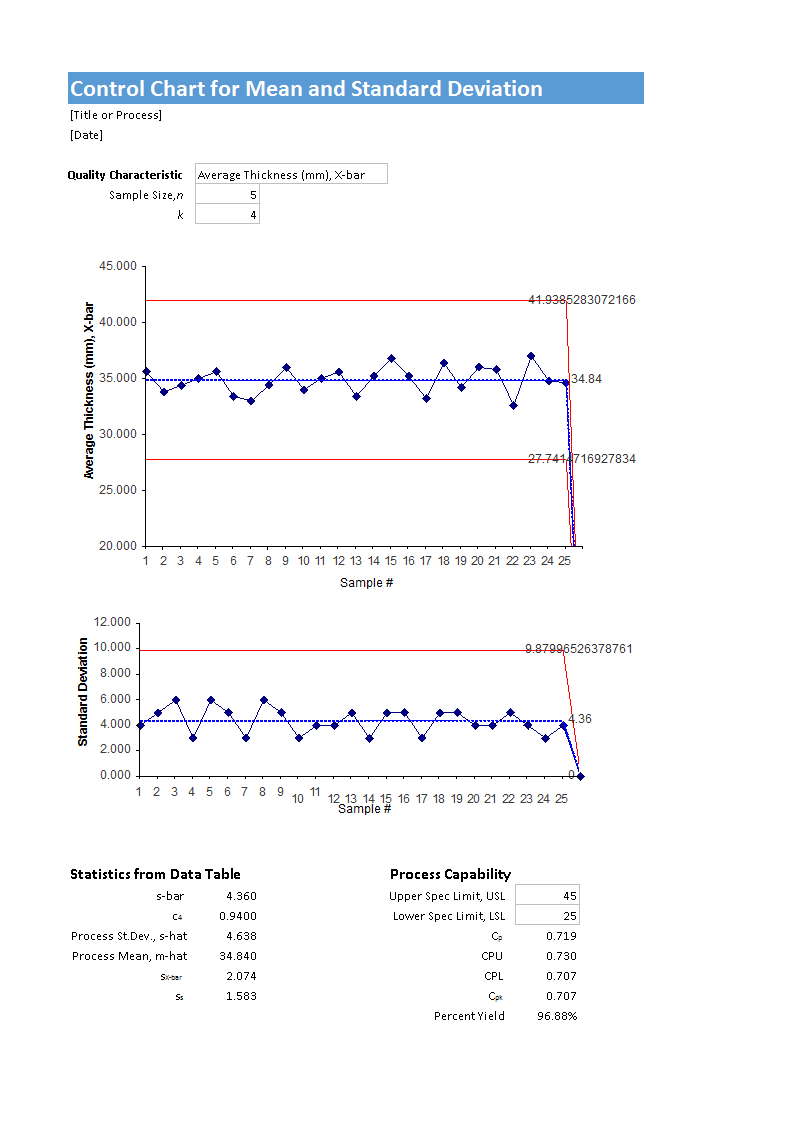
This Control Chart template creates an X-bar Chart and R Chart with control limits calculated from values contained in the data table. All samples are assumed to be the same size.
- Enter the label and the sample size for the quality characteristic that you are monitoring.
- Choose a k-value (typically 3) for setting the control limits.
- Replace the X-bar and Range values in the Data Table with your own dataset (use Paste Special - Values).
- You can delete unused rows in the data table.
- If you need to insert additional rows in the data table, insert rows above the gray line below the table so that series in the chart expand accordingly. Copy the formulas for CL, UCL, and LCL to fill in the blank spaces.
- The labels for CL, UCL, and LCL within the chart are created by selecting the last Data Point and formatting it so that the Data Labels include both the Series name and the Value.
This Excel spreadsheet is grid-based and designed to organize information and perform calculations with scalable entries. People all around the world use spreadsheets to create tables for any personal or business needs.
This Excel template is a great way to increase your performance and productivity. It gives you access to do remarkable things with Excel, even if you only have a basic understanding of working with formulas and spreadsheets. If time or quality is of the essence, this ready-made presentation can certainly help you out! Just download this file directly to your computer, open it, modify it, save it as a PDF or print it directly.
Using this Control Chart Excel template guarantees you will save time and effort! Making charts in Excel has never been easier! Our Excel templates are regularly screened and used by professionals. You will see that finishing strong Excel has never been easier!
Download this Control Chart Excel template now for your own benefit!
HAFTUNGSAUSSCHLUSS
Nichts auf dieser Website gilt als Rechtsberatung und kein Mandatsverhältnis wird hergestellt.
Wenn Sie Fragen oder Anmerkungen haben, können Sie sie gerne unten veröffentlichen.