Printable Polar Coordinate Graph Paper
Enregistrer, Remplir les champs vides, Imprimer, Terminer!
How to create a Polar Coordinate Graph Paper? Here's how to use a Polar Circle Graph Paper effectively. Download this Printable Polar Coordinate Graph Paper template now!
Formats de fichiers gratuits disponibles:
.pdf- Ce document a été certifié par un professionnel
- 100% personnalisable

Business Entreprise Education Éducation polar graph paper papier graphique polaire graph graphique Printable Imprimable Paper Papier Coordinate Coordonner Waterproof Imperméable Polar Polaire
How to create polar coordinate graph paper? Are you looking for lined or graph paper templates? Our templates are easy to use and can be printed in a variety of sizes. These lined paper templates are great for writing notes and sketching. Download this free appealing printable polar coordinate graph paper now!
Find or create stunning lined paper or graph paper designs. Whether you or your son or daughter is writing a story, drawing a beautiful picture, composing a poem, or taking notes on a scientific experiment, it is always useful to have access to the lined or decorative paper. That’s why we provide you with a large collection of printable lined paper for home and school usage.
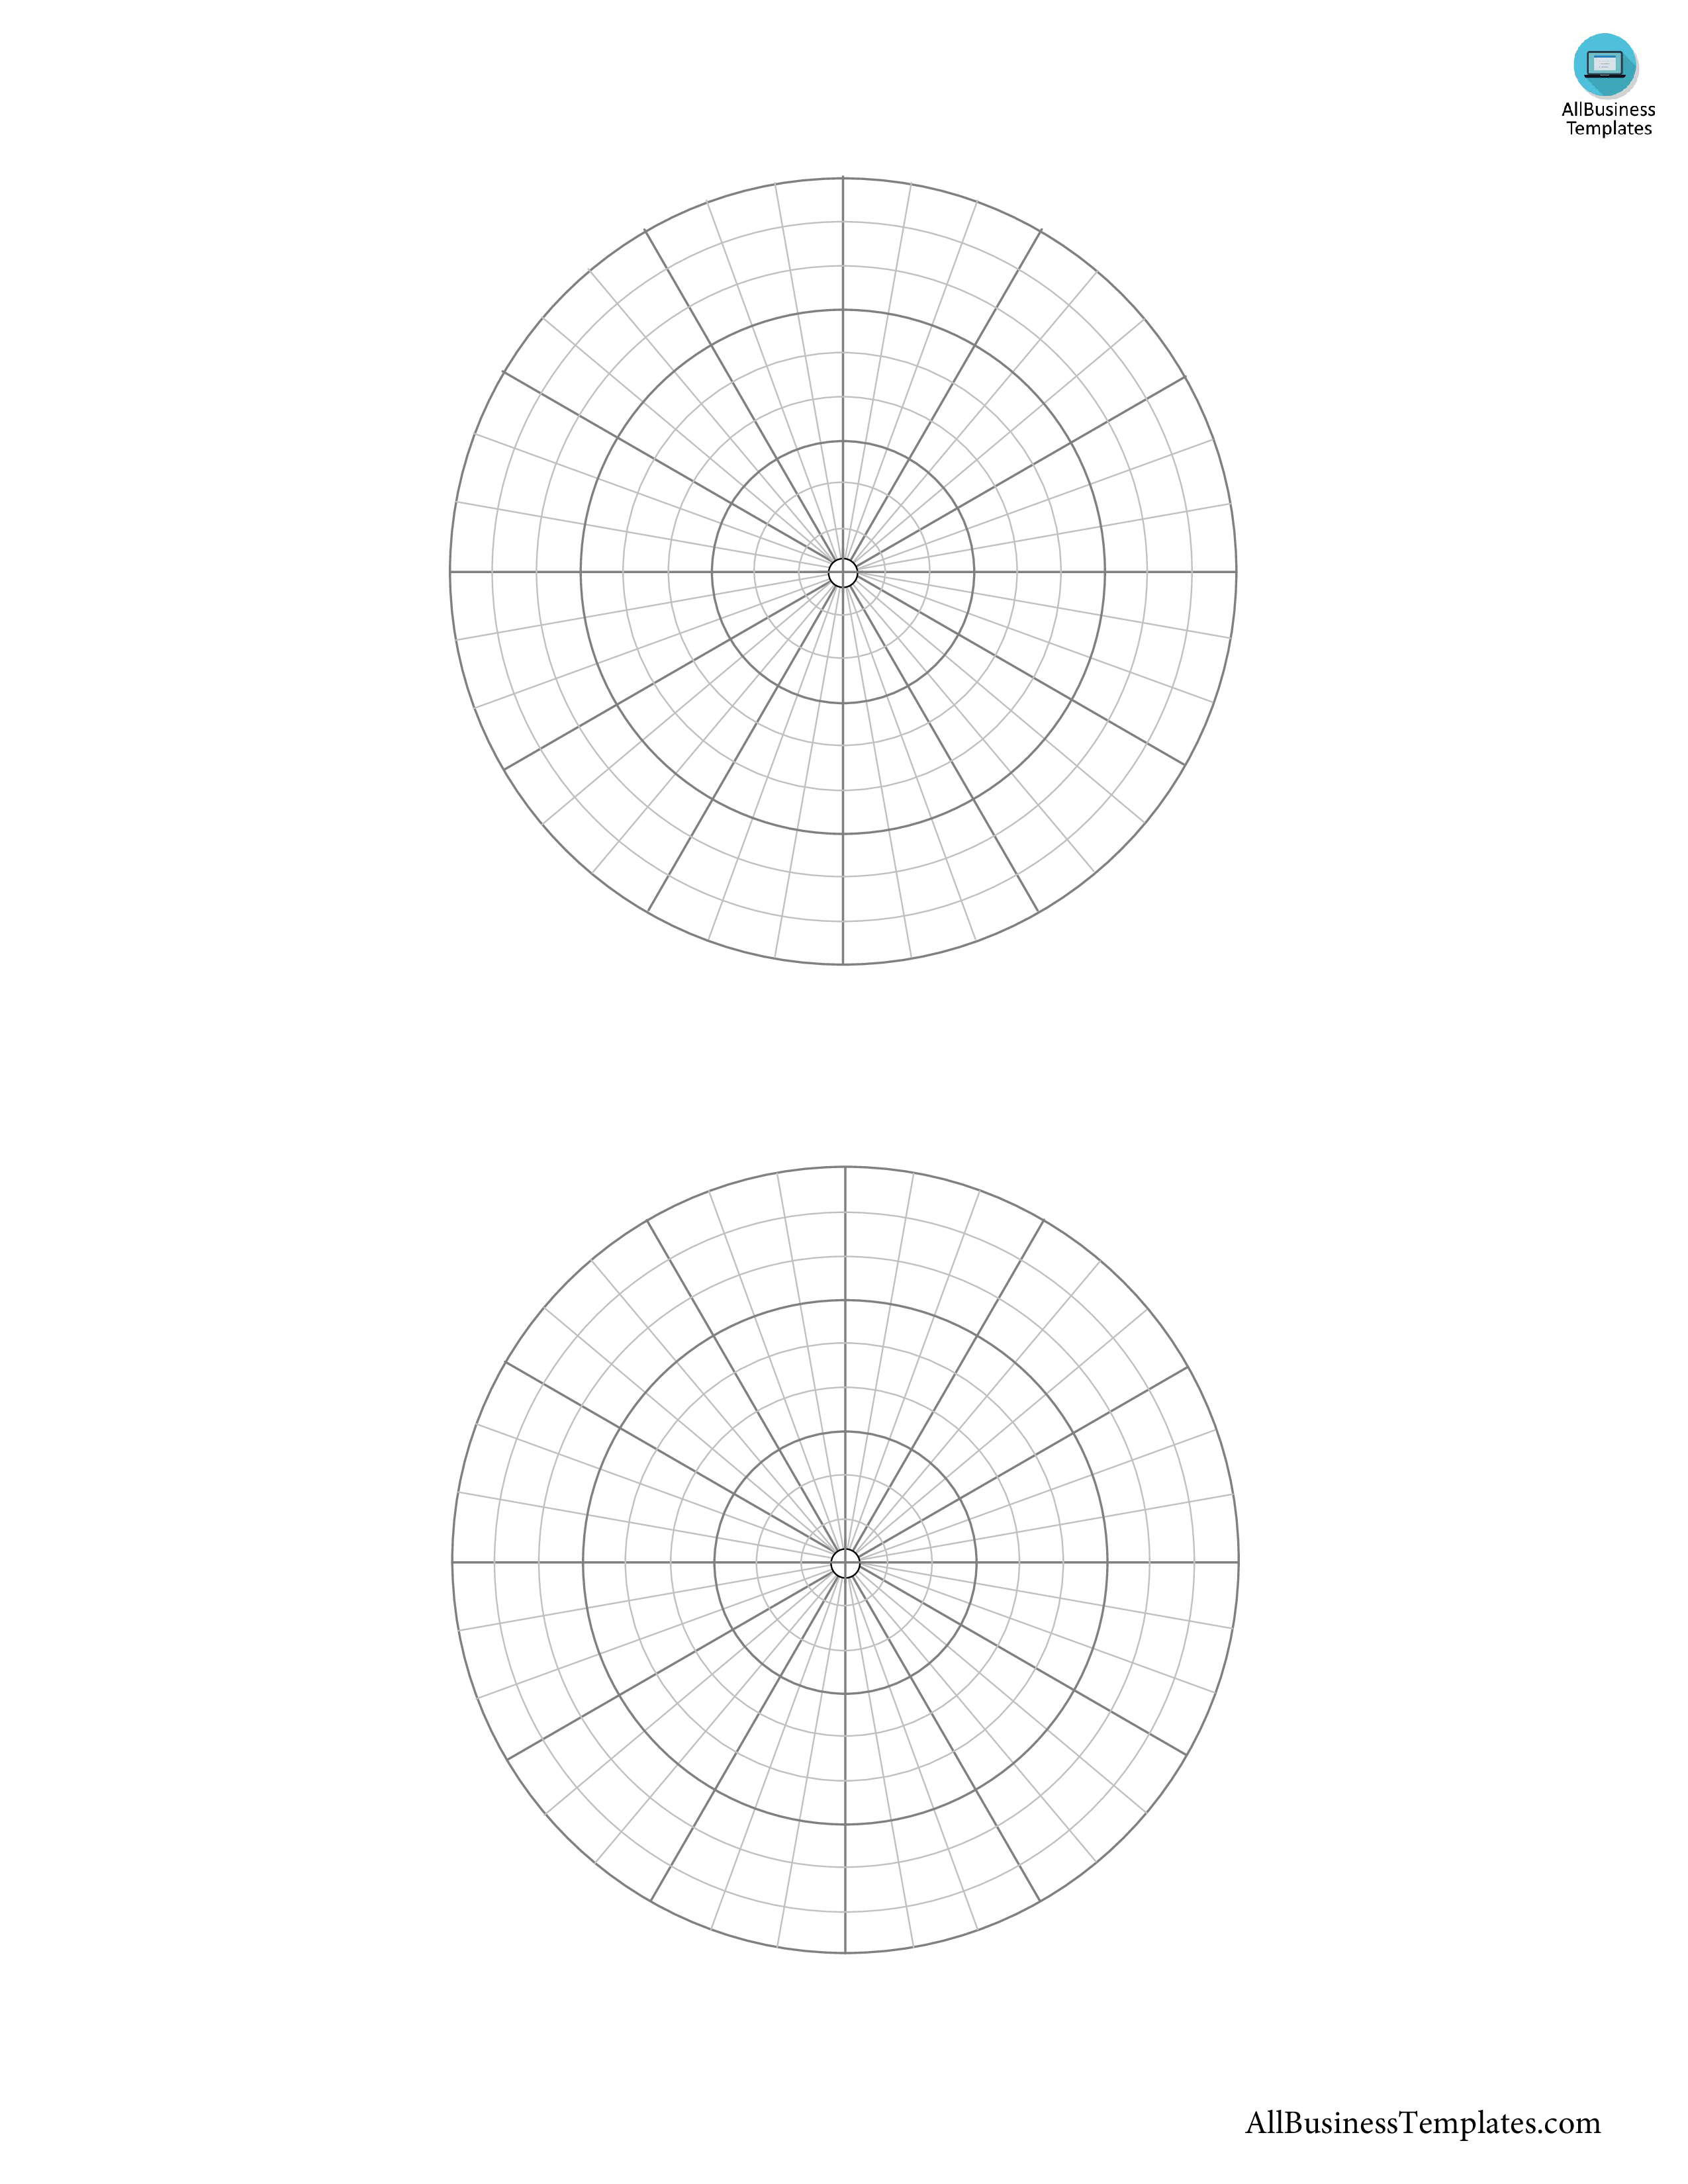
A Polar Circle Graph Paper, also known as polar coordinate paper or polar graph paper, is a specialized type of graph paper used for plotting and graphing data in polar coordinates. Polar coordinates are a way of representing points in a plane using a distance from the origin (r) and an angle (θ).
Here's how to use a polar circle graph paper effectively:
- Understand the Coordinates: In a polar coordinate system, each point is represented by (r, θ), where "r" is the distance from the origin (usually the center of the paper) and "θ" is the angle measured in degrees or radians. The angle θ is measured from the reference axis (usually the positive x-axis) in a counterclockwise direction.
- Set Up the Paper: Look at the polar graph paper. It's typically circular and divided into concentric circles, with radial lines (lines radiating from the center) and angular markings.
- Label the Axes: The center of the graph represents the origin (0,0). The radial lines are the equivalent of x-axis lines, and they are labeled with the values of r. The angular markings indicate the angles θ, often labeled in degrees.
- Plotting Points: To plot a point (r, θ), start from the origin and move outward along the radial line corresponding to "r." Then, rotate counterclockwise from the reference axis by the angle "θ." Mark the point where the line intersects the circle or curve.
- Connecting Points: If you're graphing a function, such as r = f(θ), you can plot multiple points by calculating the value of "r" for different angles and then connecting those points smoothly to visualize the curve.
- Drawing Curves: Connect the plotted points with a smooth curve to represent the function or data set you're graphing. If you're graphing equations involving trigonometric functions or circles, you'll see the patterns emerge.
- Using Axes: Sometimes, you might want to use multiple sets of axes to compare different functions or data sets. You can draw additional radial lines and angular markings to create multiple coordinate systems on the same paper.
- Labeling: Label your axes with the appropriate units for r and θ, depending on what you're graphing. If you're representing data or a mathematical function, make sure to provide a legend or labels to indicate the meaning of the plotted curves.
- Accuracy: Use a ruler to ensure accurate measurements, especially for the values of "r." Keep in mind that while polar graph paper is useful for plotting curves with polar coordinates, it might not be the best choice for linear data or functions.
- Practice: The more you practice using polar graph paper, the more comfortable you'll become with interpreting and creating graphs in polar coordinates. Experiment with different functions, angles, and curves to enhance your understanding.
Remember that polar graph paper is a tool to help you visualize data in a polar coordinate system. It's especially useful for plotting functions that have a circular or radial nature, such as circles, spirals, and waves. We offer favorable printable paper for beginning writers, shaded yellow or blue lines that somehow encourage the neatest handwriting!
It is the perfect choice for those who are working in or looking for educational or recreational lined paper templates. Print with your normal settings or go borderless for a perfect result.
Choose from many different styles and designs to suit all ages, and print them out as you need them. Simply browse our gallery of professionally designed signs and templates. If this Polar Circle Graph Paper is not exactly what you were looking for, then please check out the rest of our:
Customize to your liking, create your own, or get free lined paper designs now! Customize to your liking, create your own, or get free lined paper designs now! Download this Printable Polar Coordinate Graph Paper template now!
AVERTISSEMENT
Rien sur ce site ne doit être considéré comme un avis juridique et aucune relation avocat-client n'est établie.
Si vous avez des questions ou des commentaires, n'hésitez pas à les poster ci-dessous.