Break-Even Analysis Excel example
Opslaan, invullen, afdrukken, klaar!
How to create a Break-even analysis Excel spreadsheet? The best way to calculate the Break Even point is by downloading this sample BEA Excel template now!
Beschikbare bestandsformaten:
.xlsx- Gevalideerd door een professional
- 100% aanpasbaar
- Taal: English
- Digitale download (12.19 kB)
- Na betaling ontvangt u direct de download link
- We raden aan dit bestand op uw computer te downloaden.

Zakelijk Verkoop wil Kosten Kosten spreadsheet vast Excel werkblad Excel sjabloon beste excel templates sjabloon Excel spreadsheet break even analysis template sample
How to create a Break-even analysis Excel spreadsheet? The best way to calculate the Break Even point is by downloading this sample BEA Excel template now!
This Excel spreadsheet is an interactive digital worksheet in tabular form and designed to organize information and perform calculations with scalable entries. It's not a matter of being a beginner or professional, from all over the world, are now using spreadsheets to create tables, calculations, comparisons, overviews, etc for any personal or business need.
This useful worksheet in Excel will make the task a little easier and can be used for organization, analysis, accounting and storage of data in order to increase your productivity. This Break-even analysis template sample gives you a headstart and is useful because it also has the basic formula’s included. If time and quality are of the essence, this worksheet can certainly help you out!
Download this Break-even analysis template sample Excel spreadsheet directly to your computer, open it, modify it or print it directly. You'll see it is a great way to increase your productivity and to bring your task to a successful ending!
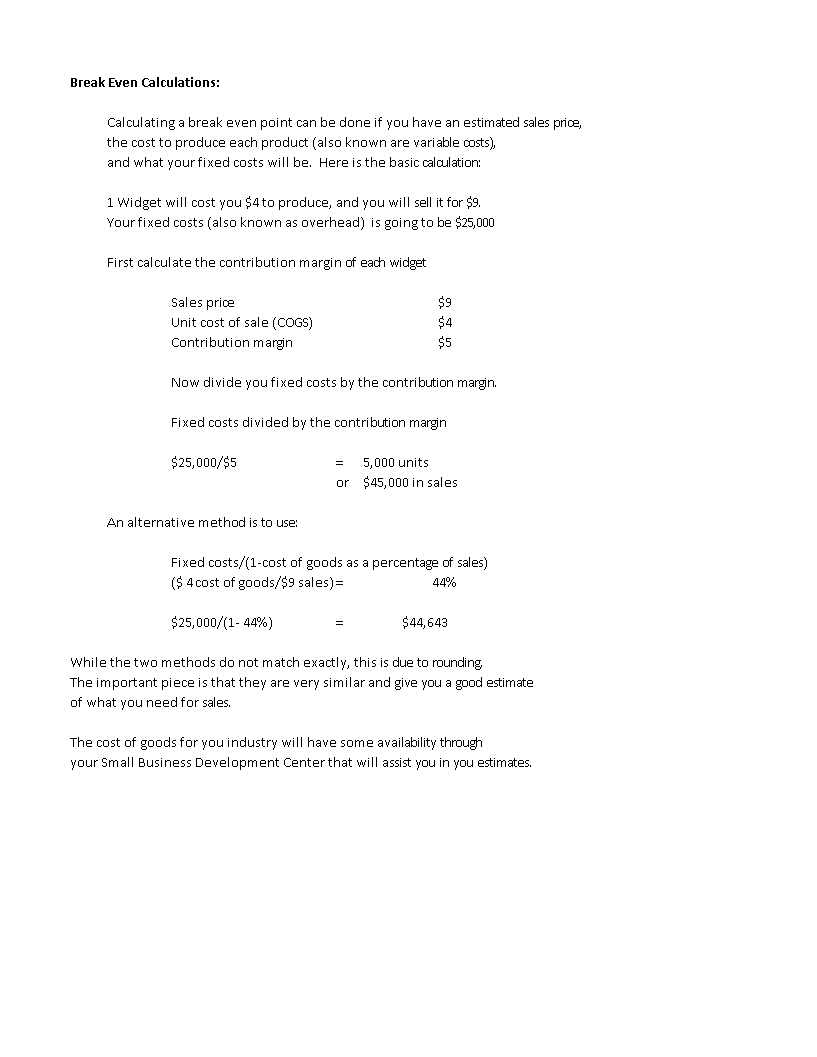
Here is the basic calculation:
1 will cost you to produce, and you will sell it for
Your fixed costs (also known as overhead) is going to be 25,000
First, calculate the contribution margin of each widget
Sales price
The unit cost of sale (COGS)
Now divide you fixed costs by the contribution margin
Fixed costs divided by the contribution margin 25,000/ 5",=,"5,000 units,or 45,000 in sales" An alternative method is to use,Fixed costs/(1-cost of goods as a percentage of sales 4 cost of goods/ 9 sales) While the two methods do not match exactly, this is due to rounding. The important piece is that they are very similar and give you a good estimate,, of what you need for sales..
DISCLAIMER
Hoewel all content met de grootste zorg is gecreërd, kan niets op deze pagina direct worden aangenomen als juridisch advies, noch is er een advocaat-client relatie van toepassing.
Laat een antwoord achter. Als u nog vragen of opmerkingen hebt, kunt u deze hieronder plaatsen.


