Fishbone-diagrammodel in MS Word
Opslaan, invullen, afdrukken, klaar!
De beste manier om een Fishbone-diagrammodel in MS Word te maken? Check direct dit professionele Fishbone-diagrammodel in MS Word template!
Beschikbare bestandsformaten:
.docxTemplate in andere talen beschikbaar:
- Gevalideerd door een professional
- 100% aanpasbaar
- Taal: English
- Digitale download (54.91 kB)
- Na betaling ontvangt u direct de download link
- We raden aan dit bestand op uw computer te downloaden.

Zakelijk Financiën Privé Opleiding strategie fishbone diagrammodel in MS woord gratis afdrukbaar visgraatdiagram voorbeeld fishbone diagram gratis visgraatdiagram visgraat visgraat diagram visgraatfiguur visbotentafel tijdlijn Analyse van bronoorzaken visgraat diagram visgraatdiagram sjabloon Excel tijdlijndiagram tijdlijn voorbeeld
How to make a Fishbone Diagram in Word? What are the steps to making a simple fishbone diagram? Check out our sample template here. It is a professionally designed template that is easy to use and customize. It includes everything you need to create a professional fishbone diagram. Download our free printable fishbone diagram template now!
Adequate communication is essential in projects, in order to have truthful and accurate information exchange in order to ensure program managers or project managers are able to do rationally and correct decision making. For those individuals, who make the biggest impacts, have, what we call, a "high-performance mindset” and are always working with the latest update of professional project management templates to achieve their goals faster!
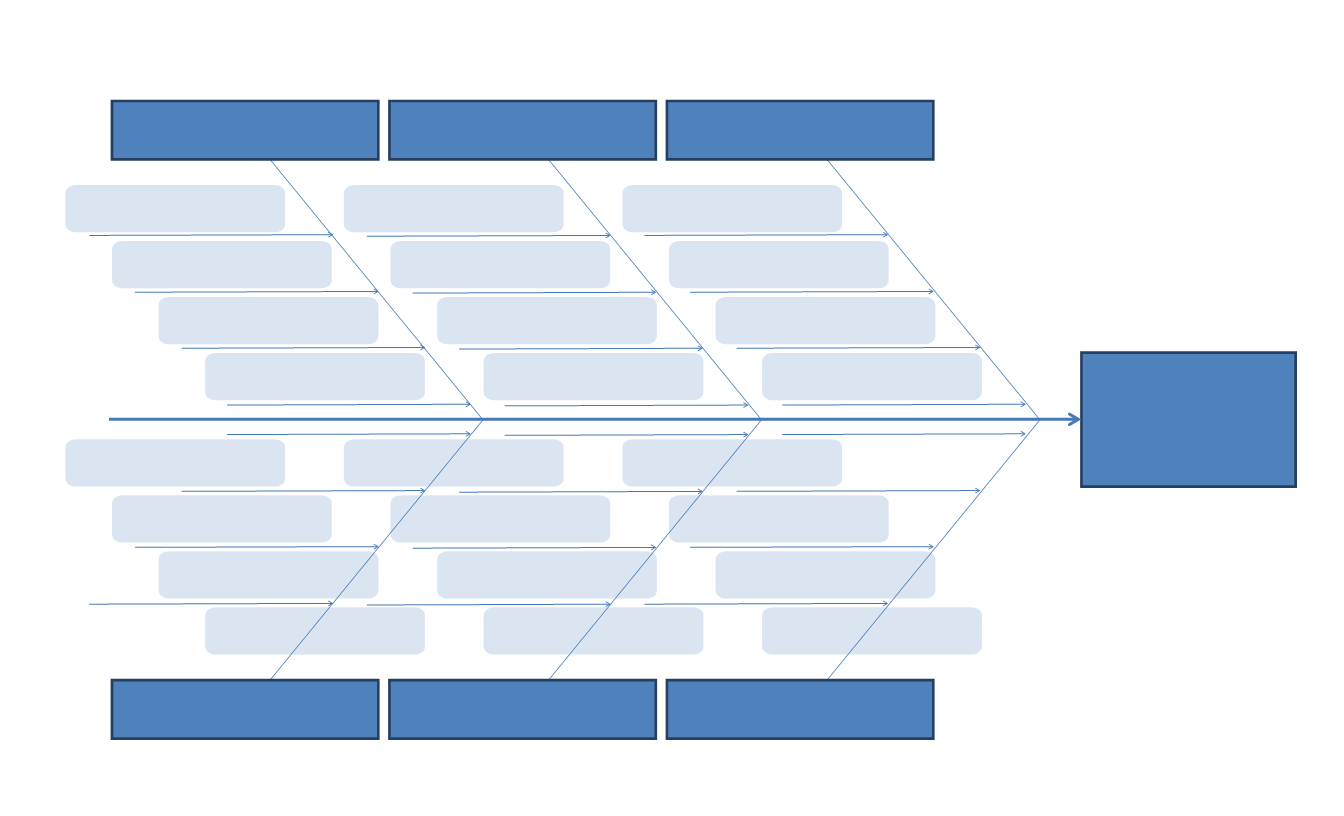
An Ishikawa diagram (also known as a Fishbone diagram, herringbone diagram, Cause-Effect diagram) is an overview that visualizes the causes of an effect or event and is often used in manufacturing and product development. The name Fishbone diagram was given due to its shape that with little imagination looks like the section view of a fish skeleton. This allows the designers or managers to outline the different activities taken in a process, and visualizes where Quality Control (QC) issues might arise, and determines what kind of resources are required at specific moments during the development.
In order to rapidly manifest your needs, you need to get clear on paper exactly what it is that you want. This fishbone diagram will help you achieve this by visualizing the important target and the supportive goals. Our template will help you structure your thoughts on every detail in a professional way!
Ishikawa diagrams became popular in the 1960’s by Kaoru Ishikawa. He is considered to be the pioneer of Quality Management processes in the Kawasaki shipyards, and became one of the founding fathers of modern management as we know it today. However, the basic concept of cause-and-effect analysis was first used in the 1920s’, considered one of the seven basic instruments to perform Quality Control.
Advantages of working with Fishbone diagram:
- Quickly identifies root-cause multiple times in the same or different causal tree
- Highly visual brainstorming instrument, leads to synergy of the brainstorm group that can detect further examples of root causes
- Allows to see in 1 overview all relevant causes simultaneously
- Perfect visualization tool to present summaries for top management and stakeholders for presenting issues
Disadvantages
- Interrelationships or correlations between causes are not easily identifiable
- No weight can be allocated to complex defects that might yield a lot of causes which might become visually cluttering
The Fishbone diagram is created by Kaoru Ishikawa, and this diagram is also known as:
- Ishikawa diagram;
- Herringbone diagram;
- Cause-and-effect diagram;
- Fishikawa diagram;
- Root-cause analysis;
- Cause-effect analysis;
Word is not the most easy way to make an Ishikawa Diagram, but it allows for easy and quick visualizations. This Fishbone Diagram is commonly used for product design purposes or quality defect prevention to identify potential factors causing an overall effect. Each cause or reason for imperfection is a source of variation. Causes are usually grouped into major categories to identify and classify these sources of variation. It will help you achieve your goals by visualizing the important target and the supportive goals. The issue or defect is shown as the fish's head, facing to the east, with the causes extending to the left as fish bones; the ribs branch off the backbone for major causes, with sub-branches for root-causes, to as many levels as required.
Start creating your own cause-effect analysis with this fishbone, it especially works well for those individuals, who aim to make the biggest impacts, and have, what they call, a "high-performance mindset” and are often using professionally designed templates to achieve their goals faster! Feel free to download this Ishikawa Diagram template, that guarantees that you will save time, cost and effort and enables you to reach the next level of success in your project, work and business!
This free printable Fishbone Diagram Model in MS Word template will help you to reach the next level of success in your work, education, or business. Try out our online Free and Premium Professional templates, forms and contracts today. Save, fill-In the blanks, print …and done!
DISCLAIMER
Hoewel all content met de grootste zorg is gecreërd, kan niets op deze pagina direct worden aangenomen als juridisch advies, noch is er een advocaat-client relatie van toepassing.
Laat een antwoord achter. Als u nog vragen of opmerkingen hebt, kunt u deze hieronder plaatsen.


