Two Proportion Z Test worksheet
I-Save, punan ang mga blanko, i-printa, Tapos na!
Where can you download Two Proportion Z Test template? What are the steps for executing this sample test template? To learn more about Two Proportion Z Test, download this sample template now and then you can start your review.
Mga magagamit na premium na format ng file:
.xls- Itong dokumento ay sertipikado ng isang Propesyonal
- 100% pwedeng i-customize

Projectmanagement Proyekto ng Pagkontrol Research statistics Science Data Analysis Analysis Pagsusuri Statistical Analysis Statistical Methods Statistical Theory Scientific Method Six Sigma Green Belt Project Defects Confidence Interval Evaluation Methods Probability And Statistics Statistical Inference Research Methods Tests Inductive Reasoning Statistical Hypothesis Testing
Where can you download the Two Proportion Z Test template? What are the steps for executing this sample test template? To learn more about the Two Proportion Z Test, download this sample template now, and then you can start your review.
A Two Proportion Z-Test worksheet is a tool or document, typically created using spreadsheet software like Microsoft Excel or Google Sheets, that helps users perform a statistical test known as the Two Proportion Z-Test. This test is used to compare two proportions (or percentages) to determine if there is a statistically significant difference between them.
The worksheet provides a structured format for organizing the necessary data and calculations required for the test. Here's what a typical Two Proportion Z-Test worksheet might include:
- Group Information: Columns to input data related to the two groups or populations being compared. This includes the sample sizes (the number of observations or cases in each group) and the proportions or percentages related to the attribute or outcome being studied.
- Hypotheses: A section to state the null hypothesis (H0) and the alternative hypothesis (Ha) for the test. The null hypothesis typically states that there is no significant difference between the two proportions, while the alternative hypothesis suggests that there is a significant difference.
- Calculation of the Pooled Proportion (p): A formula or calculation section to find the pooled proportion.
- Calculation of the Z-Score: A section to calculate the Z-score using the formula for the Two Proportion Z-Test,
- Critical Value: A section to input or calculate the critical value based on the chosen level of significance (alpha) and the test's degrees of freedom.
- Comparison of Z-Score and Critical Value: A section to compare the calculated Z-score with the critical value. If the Z-score is greater (in absolute value) than the critical value, you will typically reject the null hypothesis, indicating a significant difference between the proportions.
- Conclusion: A space for users to interpret the results and draw conclusions based on the test's findings.
A Two Proportion Z-Test worksheet is a practical tool for researchers, statisticians, and students who need to analyze data and determine whether there is a statistically significant difference in proportions between two groups or populations. It helps streamline the calculations and facilitates the reporting of results.
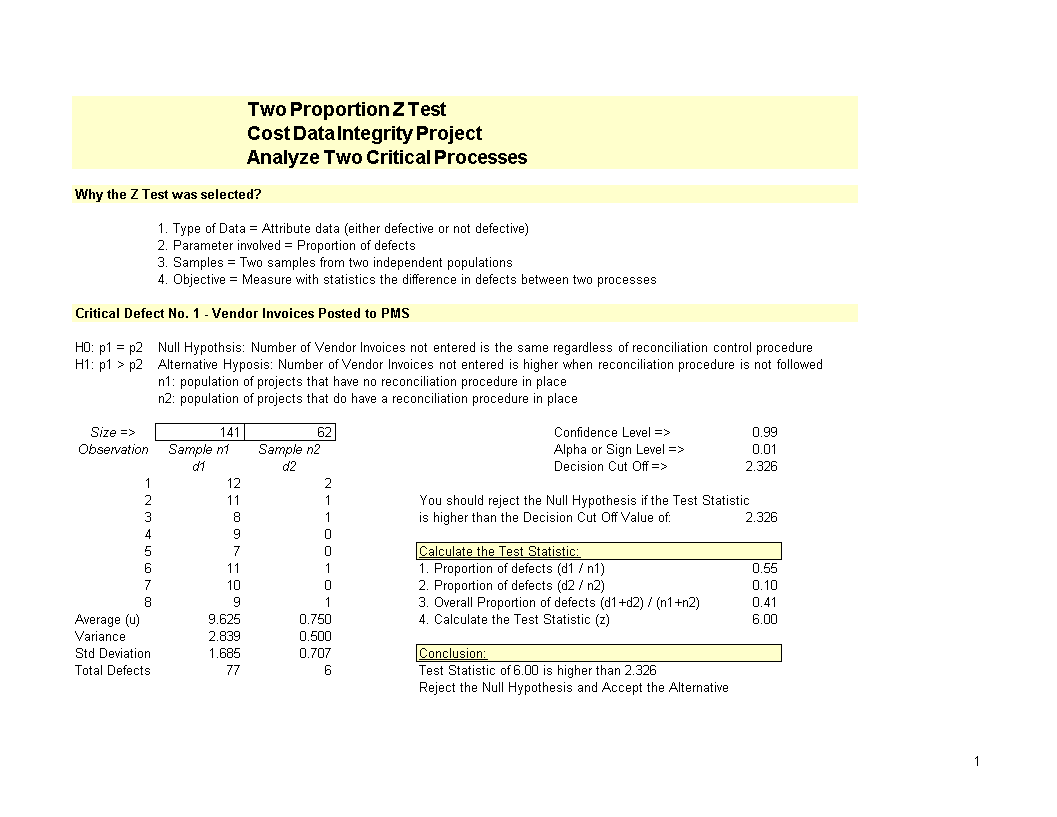
This Six Sigma Green Belt Project Z test enables you to do a Cost Data Integrity Project analysis. It provides a framework to analyze two critical processes.
Content:
1 - Vendor Invoices Posted to PMS H0: p1 = p2, Null Hypothesis: Number of Vendor Invoices not entered is the same regardless of reconciliation control procedure, H1: p1 p2, Alternative Hyposis: Number of Vendor Invoices not entered is higher when reconciliation procedure is not followed,n1: population of projects that have no reconciliation procedure in place,n2: population of projects that do have a reconciliation procedure in place Size = ,141,62} Confidence Level = "0,99" Observation, Sample n1, Sample n2},{},{Alpha or Sign Level = },{"0,01" ,d1,d2},{},{Decision Cut Off = },You should reject the Null Hypothesis if the Test Statistic.
This worksheet enables you to do statistical data analysis. It gives you a tool to find out the Decision Cut Off Value of Calculating the Test Statistic. Having this value will help you to make decisions in a more empirical way.
Download this Two Proportion Z test now.
DISCLAIMER
Wala sa 'site' na ito ang dapat ituring na legal na payo at walang abogado-kliyenteng relasyon na itinatag.
Mag-iwan ng tugon. Kung mayroon kang anumang mga katanungan o mga komento, maaari mong ilagay ang mga ito sa ibaba.


