Blank Control Chart
I-Save, punan ang mga blanko, i-printa, Tapos na!
How to create a Control Chart? An easy way to start making a visual data analysis is to download this Blank Control Chart template now!
Mga magagamit na premium na format ng file:
.pdfIba pang magagamit na mga wika:
- Itong dokumento ay sertipikado ng isang Propesyonal
- 100% pwedeng i-customize

Business Negosyo equipment person Control Chart Appropriate Charts Failed Date Blank Control Chart Sample Blank Control Chart Blank Control Chart Example process capability chart spc tools excel run chart template statistical process control charts examples how to create a control chart in excel Plot Diagram dmaic monitoring plan six sigma one pager green belt control plan template lean six sigma project closure innovation transfer opportunities visual management checklist how to calculate how to calculate control limits i mr chart minitab capability analysis minitab capability analysis minitab standard deviation formula minitab control chart specification limit control charts cheat sheet 3 sigma p chart in excel make a p chart spc p chart excel download sample control control chart problems solutions r chart calculator ucl formula control chart constants control limits are quality control in r
How to create a Control Chart? An easy way to start making a visual data analysis is to download this Blank Control Chart template now!
Every day brings new projects, emails, documents, and task lists, and often it is not that different from the work you have done before. Many of our day-to-day tasks are similar to something we have done before. Don't reinvent the wheel every time you start to work on something new!
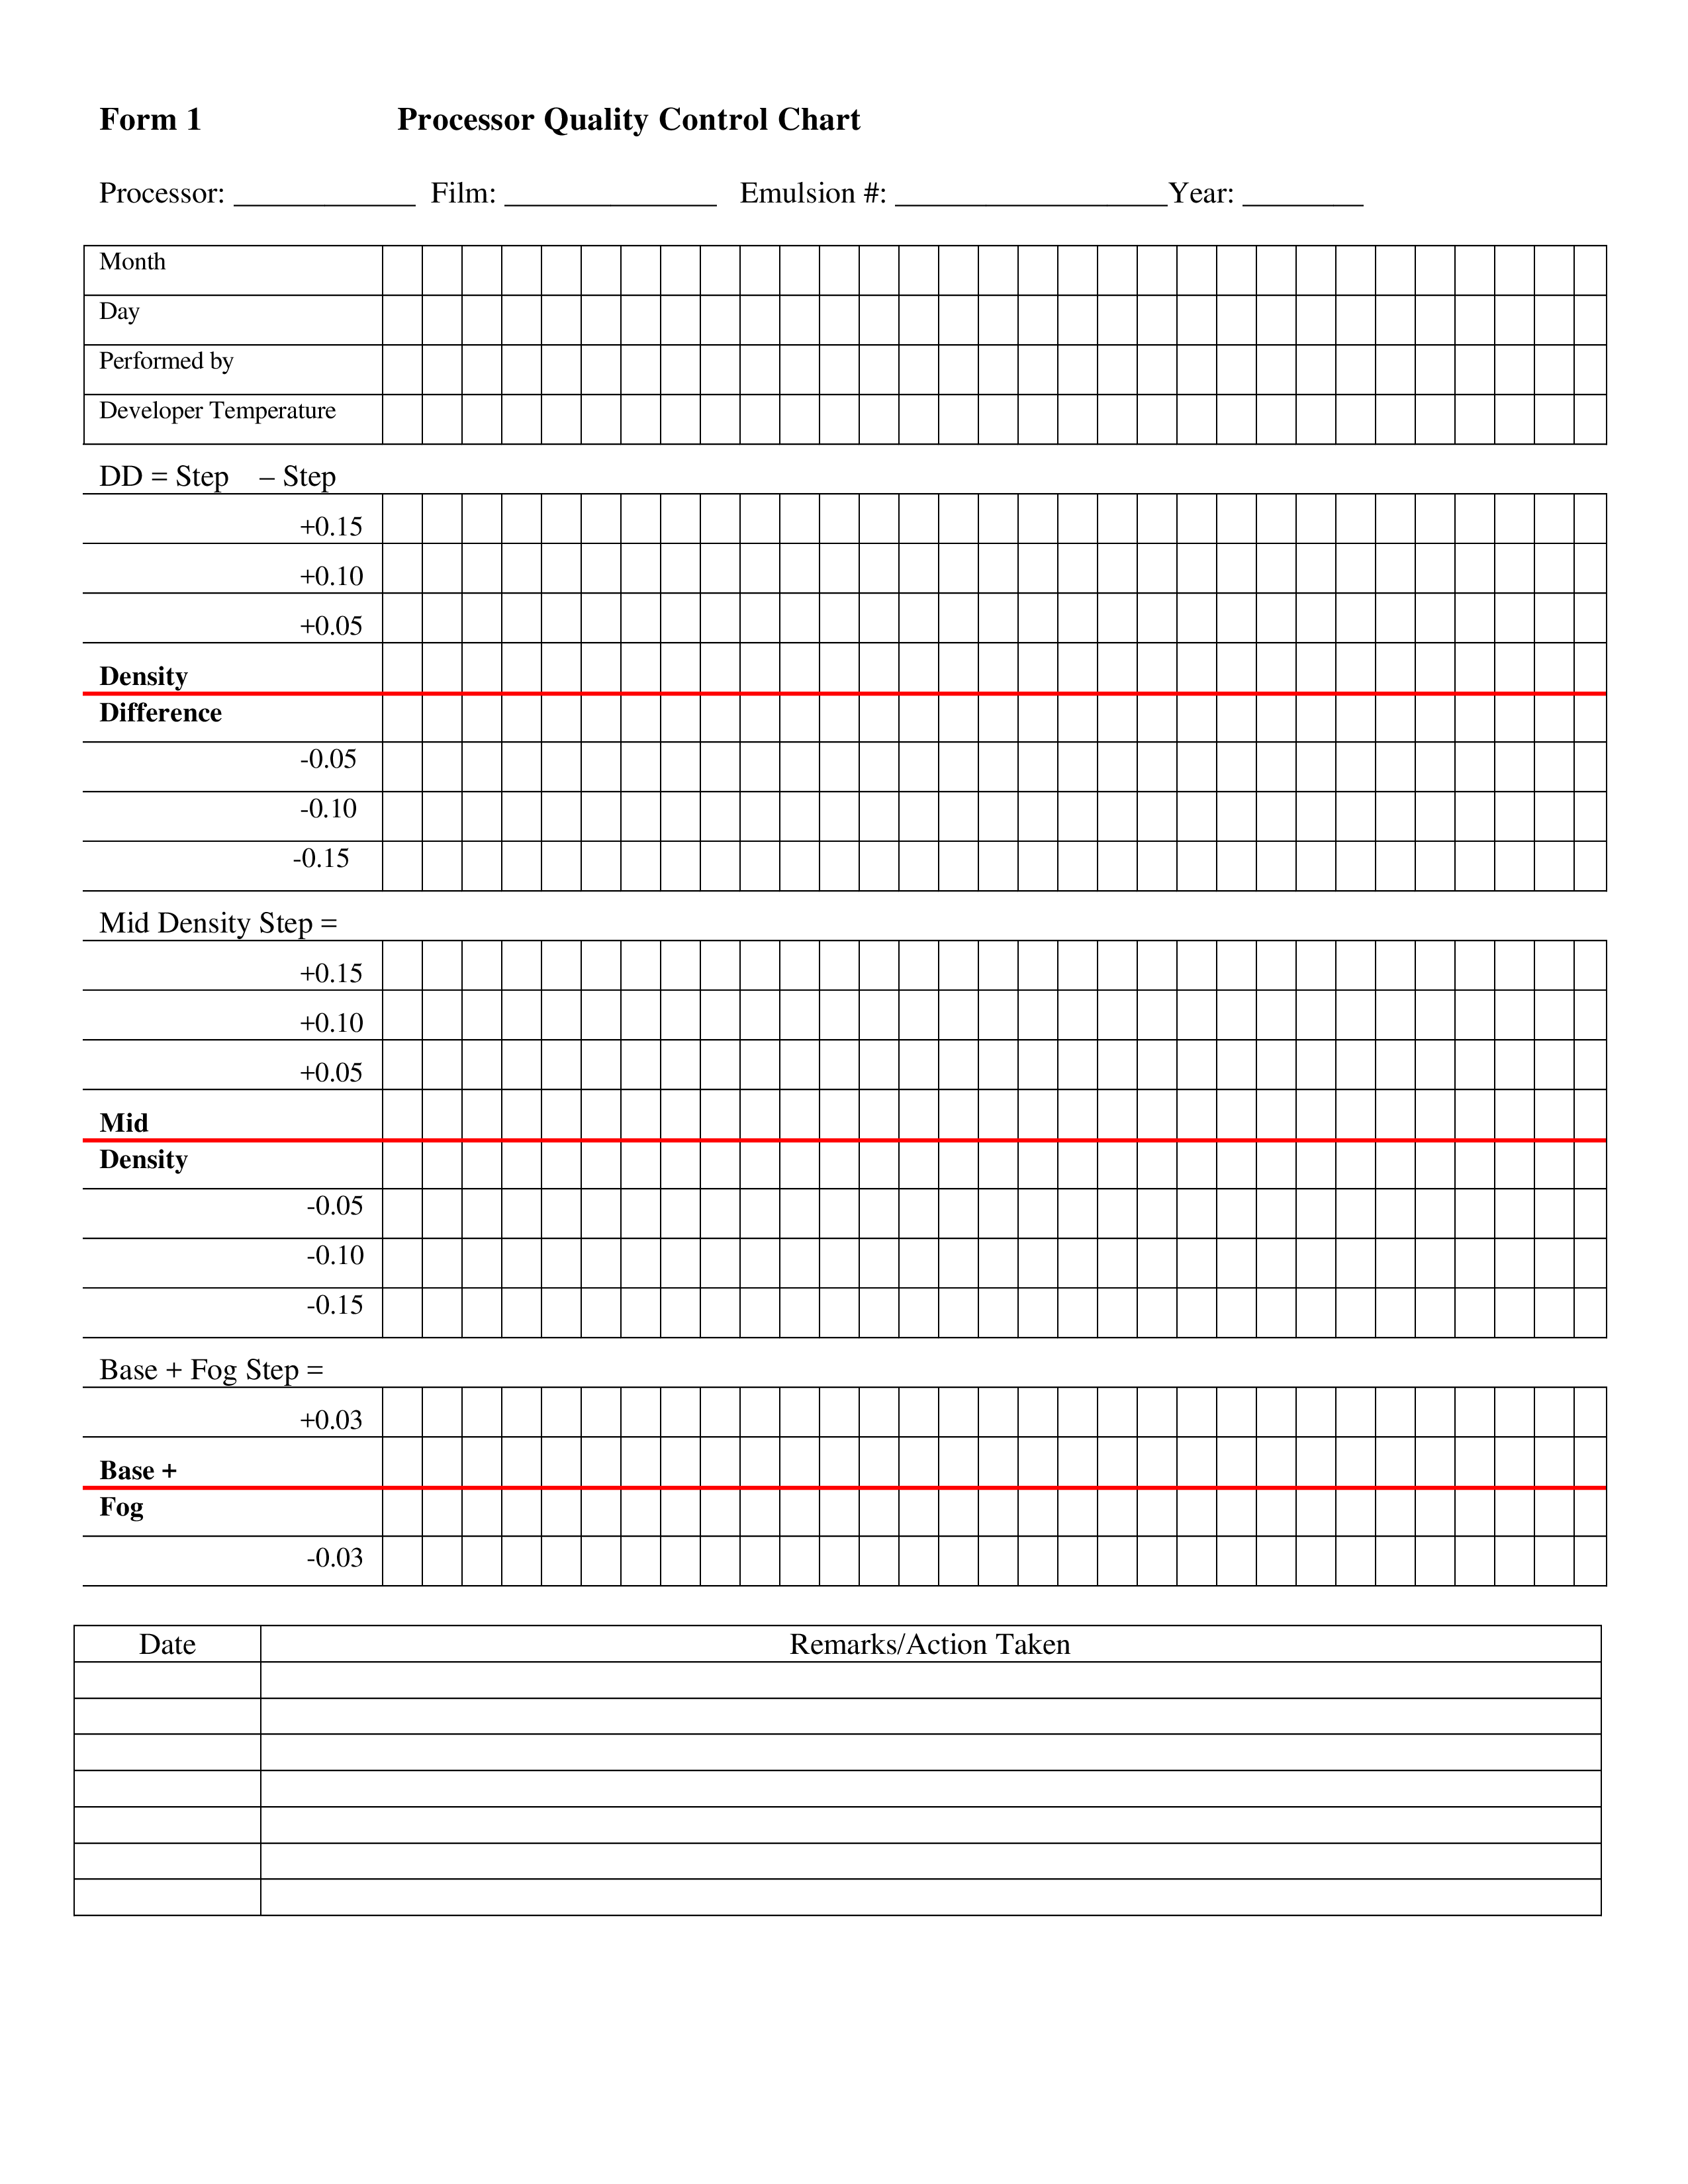
The Control Charts in this document are very useful and the most common types of control charts, for example the X-Bar chart (which allows you to do plotting the mean of a sample over time). Also you can find the S-chart (plotting the sample standard deviation over time and the R-chart (to do plotting of a range or Max-Min of a sample over time).
These blank control charts are based on the terminology used and that explains the formulas and steps for creating these control charts.
This file contains blank control chart templates that can be used for statistical analysis. For example for Mean and Range, or sample Mean and Standard Deviation (2 worksheets in one). You can just put your your own data in the charts, in order to visualize the data. Control limits are calculated based on the data you enter. In the X-bar & R control chart, the number of observations per sample (n) can be between 2 and 25. In the X-bar & S chart, n must be greater than 4.
Although there are many Statistical Process Control (SPC) software tools available to analyze and visualize data, it happens that researchers also create control charts in Excel or on a hardcopy.
For those, these blank Control Chart Templates can be very useful. Also it can function as educational tools to teach childeren or adults and to make equations.
Instead, we provide this standardized Blank Control Chart template with text and formatting as a starting point to help professionalize the way you are working. If time or quality is of the essence, this ready-made template can help you to save time and to focus on the topics that really matter!
Using this control chart document guarantees you will save time and effort! It comes in Microsoft Office format, is ready to be tailored to your personal needs. Completing your data analysis has never been easier!
Download this Blank Control Chart template now for your own benefit!
Mid-density (MD) Step Average density Density difference (DD) = HD - LD High-Density (HD) Low-density (LD) 17 18 19 20 21 B+F Form 3 Cross-Over Data Sheet Date Performed: Base + Fog Old Emulsion Data New Emulsion Data Old Emulsion New Emulsion MD LD HD Base + Fog MD LD HD Strip 1 Strip 2 Strip 3 Strip 4 Strip 5 Average Density Difference = HD - LD Density Difference = HD – LD DD = DD = Determining Differences Between Old and New Emulsions Base + Fog MD Determining New Operating Level from Old Level and Differences DD Base + Fog New Emulsion Average Difference (New-Old) Old Emulsion Average Old Operating Level Difference (New-Old) New Operating Level (Diff +Old) MD DD Form 2 Laser Film Printer Control Chart Year: ___________ Laser Film Printer: ____________ Film: ________________________ Month Day Initials 0 2.6 2.45 2.3 10 2.25 2.10 1.95 40 1.00 1.15 1.30 90 0.22 0.3 0.38 5 visible in 0 95 visible in 100 Date Remarks/Action Taken Form 5 Quality Control Log - Bimonthly Tests Page _____ of ______ Each time a listed procedure is completed, person performing it must fill in date, their initials and note if equipment passed or failed..
DISCLAIMER
Wala sa 'site' na ito ang dapat ituring na legal na payo at walang abogado-kliyenteng relasyon na itinatag.
Mag-iwan ng tugon. Kung mayroon kang anumang mga katanungan o mga komento, maaari mong ilagay ang mga ito sa ibaba.


