Fishbone Diagram Excel
I-Save, punan ang mga blanko, i-printa, Tapos na!
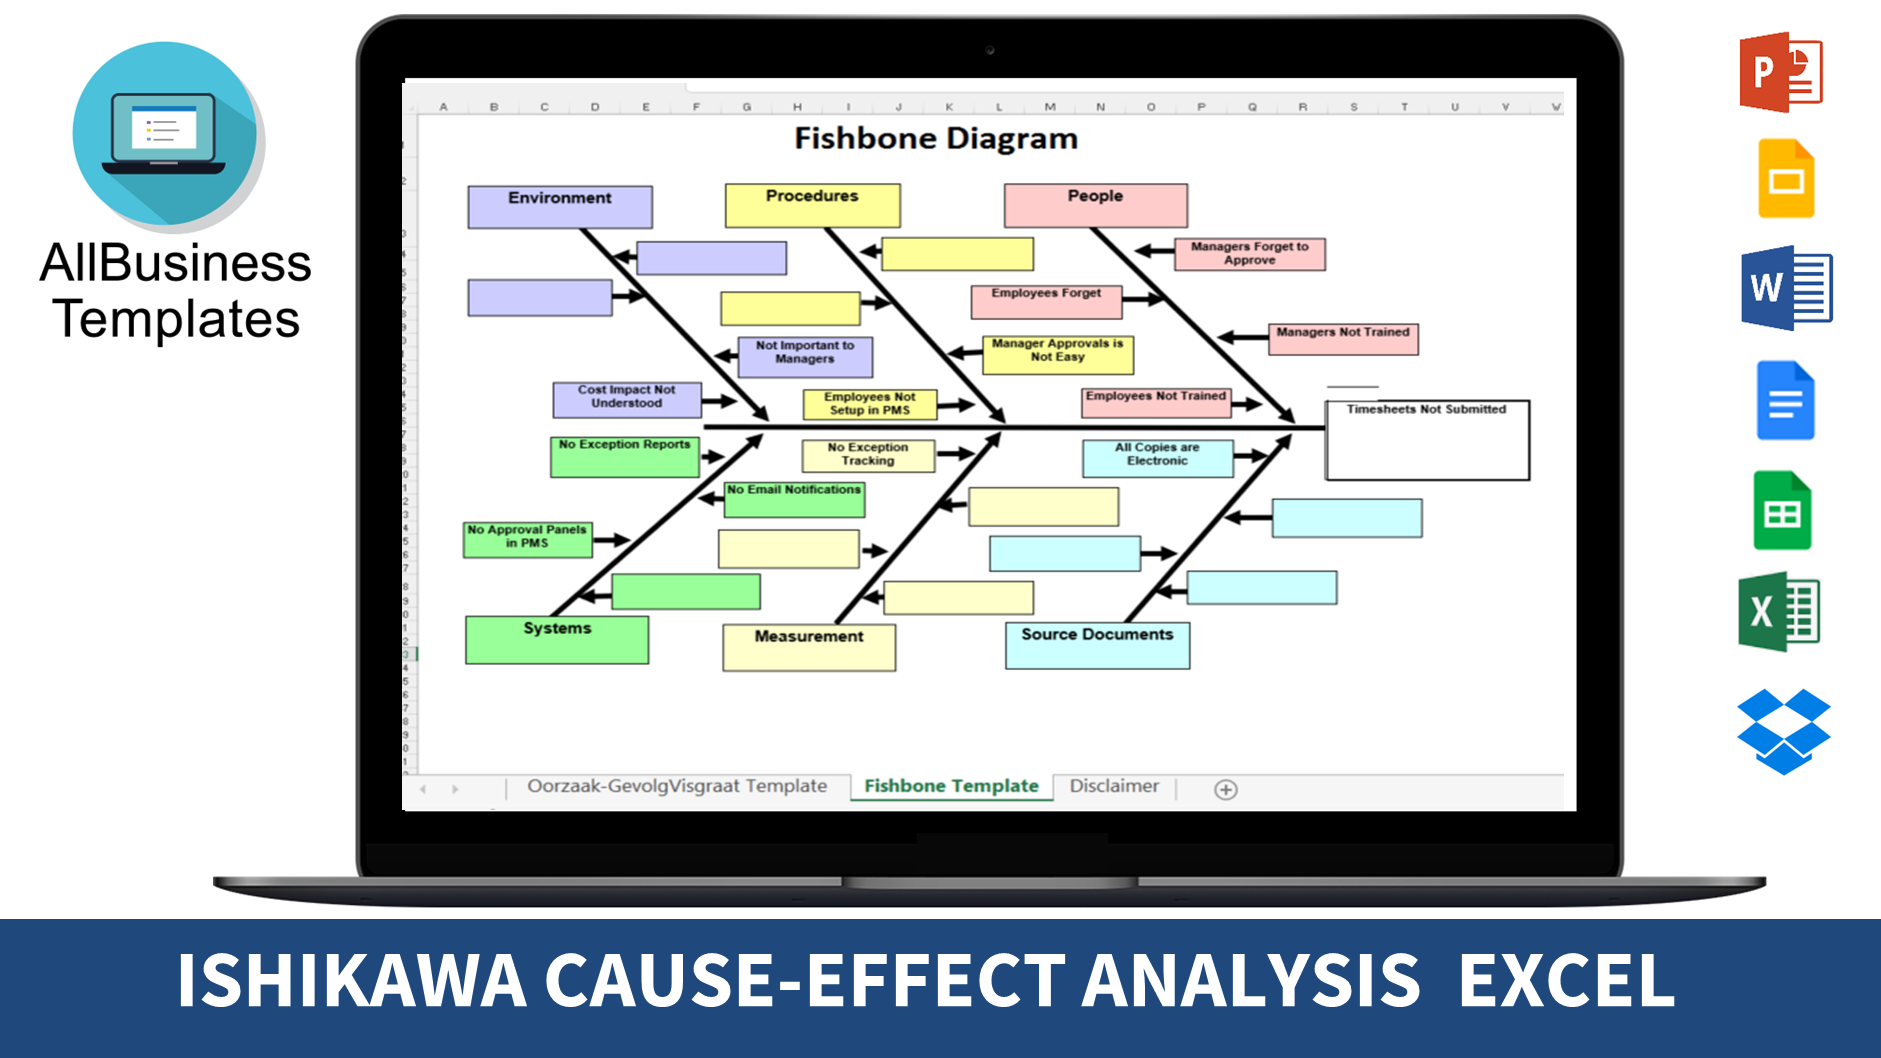
Are you looking for a sample fishbone diagram template in Excel? Download this sample diagram template now which will help you identify the root cause of a problem by visualizing its causes and effects.
Mga magagamit na premium na format ng file:
.xlsIba pang magagamit na mga wika:
- Itong dokumento ay sertipikado ng isang Propesyonal
- 100% pwedeng i-customize

Business Negosyo project management fishbone diagram fishbone timeline takdang panahon Excel Technology Employees Diagram Managers Root Cause Analysis Quality fishbone diagram sample sample fishbone diagram fishbone diagram example fishbone diagram model fishbone diagram xls fishbone diagram in excel how to make fishbone diagram projetmanagement diagram fishbone fisbhone herringbone diagram excel templates Excel templates for business best excel templates project management excel templates ishikawa diagram template ishikawa excel diagram ishikawa excel diagram template use of ishikawa diagram ishikawa diagram is also known as fishbone analysis cause and effect diagram example cause effect diagram example cause effect diagram fishbone diagram pdf fishbone diagram template excel Excel ng template ng fishbone diagram fishbone diagram cause and effect cause and effect analysis analysis template analysis method excel template analysis excel template analysis method excel herringbone fishbone analysis ishikawa fishbone analysis kaoru ishikawa timeline diagram diagram ng timeline timeline example halimbawa ng timeline
What are the key categories of causes typically used in a Fishbone Diagram, and how are they organized? Are you looking for a sample fishbone diagram template in Excel? Getting this template now will help you identify the root cause of a problem by visualizing its causes and effects.
An Ishikawa diagram (also known as a Fishbone diagram, herringbone diagram, or Cause-Effect diagram) is an overview that visualizes the causes of an effect or event and is often used in manufacturing and product development. The name Fishbone diagram was given due to its shape that with little imagination looks like the section view of a fish skeleton. This allows the designers or managers to outline the different activities taken in a process, and visualize where Quality Control (QC) issues might arise, and determine what kind of resources are required at specific moments during the development.
Ishikawa diagrams became popular in the 1960’s by Kaoru Ishikawa. He is considered to be the pioneer of Quality Management processes in the Kawasaki shipyards and became one of the founding fathers of modern management as we know it today. However, the basic concept of cause-and-effect analysis was first used in the 1920s, considered one of the seven basic instruments to perform Quality Control.
Advantages of working with Fishbone diagram:
- Quickly identifies root cause multiple times in the same or different causal tree
- A highly visual brainstorming instrument leads to the synergy of the brainstorming group that can detect further examples of root causes
- Allows to see in 1 overview all relevant causes simultaneously
- Perfect visualization tool to present summaries for top management and stakeholders for presenting issues
Disadvantages
- Interrelationships or correlations between causes are not easily identifiable
- No weight can be allocated to complex defects that might yield a lot of causes that might become visually cluttering
Kaoru Ishikawa creates the Fishbone diagram, and this diagram is also known as:
- Ishikawa diagram;
- Herringbone diagram;
- Cause-and-effect diagram;
- Fishikawa diagram;
- Root-cause analysis;
- Cause-effect analysis;
Excel is not the easiest way to make an Ishikawa diagram, but it allows for easy calculations or easy ways to fill in the fields. This fishbone diagram is commonly used for product design purposes or quality defect prevention to identify potential factors causing an overall effect. Each cause or reason for imperfection is a source of variation. Causes are usually grouped into major categories to identify and classify these sources of variation. It will help you achieve your goals by visualizing the important and supportive targets. The issue or defect is shown as the fish's head, facing east, with the causes extending to the left as fish bones; the ribs branch off the backbone for major causes, with sub-branches for root causes, to as many levels as required.
Feel free to download this Ishikawa diagram template, which guarantees that you will save time, cost, and effort and enable you to reach the next level of success in your project, work, and business!
Download this Ishikawa diagram template in Excel now and start creating your cause-effect analysis.
DISCLAIMER
Wala sa 'site' na ito ang dapat ituring na legal na payo at walang abogado-kliyenteng relasyon na itinatag.
Mag-iwan ng tugon. Kung mayroon kang anumang mga katanungan o mga komento, maaari mong ilagay ang mga ito sa ibaba.


