fishbone diagram template sheet in excel
I-Save, punan ang mga blanko, i-printa, Tapos na!
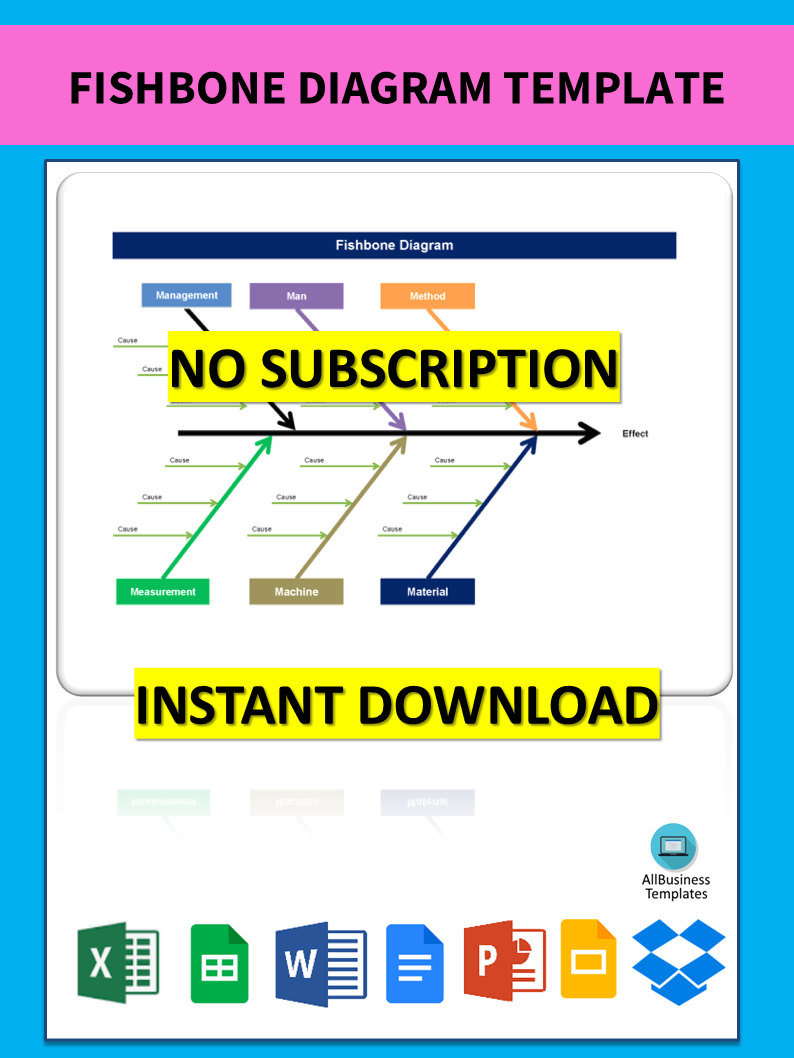
What is the procedure to create the fishbone diagram in Excel? The easiest way to create your own Ishikawa diagram template is click here to get this cause and effect analysis table now!
Mga magagamit na premium na format ng file:
.xlsxIba pang magagamit na mga wika:
- Itong dokumento ay sertipikado ng isang Propesyonal
- 100% pwedeng i-customize

Business Negosyo fishbone project timeline timeline ng proyekto timeline takdang panahon Excel Spreadsheet Diagram Root Cause Analysis herringbone diagram Project Management Timeline Timeline ng Pamamahala ng Proyekto Excel spreadsheet spreadsheet ng Excel Excel template Excel templates for business best excel templates project management excel templates xls xlsx Fishbone Diagram Template Template ng Fishbone Diagram template Excel spreadsheet template ng Excel spreadsheet fishbone diagram template sheet in excel sample fishbone diagram template sheet in excel template ishikawa diagram template ishikawa excel diagram ishikawa excel diagram template use of ishikawa diagram ishikawa diagram is also known as fishbone analysis cause and effect diagram example cause effect diagram example cause effect diagram fishbone diagram pdf fishbone diagram template excel Excel ng template ng fishbone diagram fishbone diagram cause and effect cause and effect analysis analysis template analysis method excel template analysis excel template analysis method excel herringbone fishbone analysis ishikawa fishbone analysis kaoru ishikawa timeline diagram diagram ng timeline timeline example halimbawa ng timeline timeline template ppt template ng timeline ppt timeline template free timeline template google docs template ng timeline Google Docs timeline template free download libreng pag download ng template ng timeline timeline template word free download libreng pag download ng salitang timeline timeline template google slides template ng timeline google slides timeline template canva timeline template ppt free timeline template blank blangko ang template ng timeline powerpoint timeline template template ng timeline ng powerpoint project timeline template excel template ng timeline ng proyekto excel wedding timeline template template ng timeline ng kasal free timeline template libreng template ng timeline powerpoint timeline template free wedding day timeline template history timeline template blank timeline template blangkong template ng timeline timeline powerpoint template free libre ang template ng timeline powerpoint
- Quickly identifies root cause multiple times in the same or different causal tree
- A highly visual brainstorming instrument leads to the synergy of the brainstorming group that can detect further examples of root causes
- Allows to see in 1 overview all relevant causes simultaneously
- Perfect visualization tool to present summaries for top management and stakeholders for presenting issues
- Interrelationships or correlations between causes are not easily identifiable
- No weight can be allocated to complex defects that might yield a lot of causes that might become visually cluttering
- Fishbone diagram;
- Herringbone diagram;
- Cause-and-effect diagram;
- Fishikawa diagram;
- Root-cause analysis;
- Cause-effect analysis.
This Excel spreadsheet is an interactive digital worksheet in tabular form and is designed to organize information and perform calculations with scalable entries. It's not a matter of being a beginner or professional, from all over the world, are now using spreadsheets to create tables, calculations, comparisons, overviews, etc for any personal or business need. This useful worksheet in Excel will make the task a little easier and can be used for organization, analysis, accounting, and storage of data to increase your productivity. This fishbone diagram template sheet in Excel gives you a head start and is useful because it also has the basic formulas included. If time and quality are of the essence, this worksheet can certainly help you out!
DISCLAIMER
Wala sa 'site' na ito ang dapat ituring na legal na payo at walang abogado-kliyenteng relasyon na itinatag.
Mag-iwan ng tugon. Kung mayroon kang anumang mga katanungan o mga komento, maaari mong ilagay ang mga ito sa ibaba.


