fishbone diagram template sheet in excel


Save, fill-In The Blanks, Print, Done!

Click on image to zoom / Click button below to see more images


Microsoft Spreadsheet (.xlsx)

Other languages available:

  • This Document Has Been Certified by a Professional
  • 100% customizable
  • This is a digital download (32.21 kB)
  • Language: English
  • We recommend downloading this file onto your computer.


ABT template rating: 8

Malware- and virusfree. Scanned by: Norton safe website
Business fishbone project timeline timeline Excel Spreadsheet Diagram Root Cause Analysis ishikawa diagram herringbone diagram Project Management Timeline Excel spreadsheet Excel template Excel templates for business best excel templates project management excel templates xls xlsx Fishbone Diagram Template template Excel spreadsheet fishbone diagram template sheet in Excel fishbone diagram template sheet in excel sample fishbone diagram template sheet in excel template ishikawa diagram template ishikawa excel diagram ishikawa excel diagram template use of ishikawa diagram ishikawa diagram is also known as fishbone analysis cause and effect diagram example cause effect diagram example cause effect diagram fishbone diagram pdf fishbone diagram template excel fishbone diagram cause and effect cause and effect analysis analysis template analysis method excel template analysis excel template analysis method excel herringbone fishbone analysis ishikawa fishbone analysis kaoru ishikawa timeline diagram timeline example timeline template ppt timeline template free timeline template google docs timeline template free download timeline template word free download timeline template google slides timeline template canva timeline template ppt free timeline template blank powerpoint timeline template project timeline template excel wedding timeline template free timeline template powerpoint timeline template free wedding day timeline template history timeline template blank timeline template timeline powerpoint template free

How to create a Fishbone Diagram Excel spreadsheet? What is fishbone diagram with examples? The best way is by downloading this fishbone diagram Excel template now!

An Ishikawa diagram (also known as Fishbone diagram, herringbone diagram, Cause-Effect diagram) is an overview that visualizes the causes of an effect or event and is often used in manufacturing and product development. The name Fishbone diagram was given due to its shape that with little imagination looks like the section view of a fish skeleton. This allows the designers or managers to outline the different activities taken in a process, and visualizes where Quality Control (QC) issues might arise, and determines what kind of resources are required at specific moments during the development.

Ishikawa diagrams became popular in the 1960’s by Kaoru Ishikawa. He is considered to be the pioneer of Quality Management processes in the Kawasaki shipyards, and became one of the founding fathers of modern management as we know it today. However, the basic concept of cause-and-effect analysis was first used in the 1920s’, considered one of the seven basic instruments to perform Quality Control. 

Advantages of working with Fishbone diagram:

  • Quickly identifies root-cause multiple times in the same or different causal tree
  • Highly visual brainstorming instrument, leads to synergy of the brainstorm group that can detect further examples of root causes
  • Allows to see in 1 overview all relevant causes simultaneously
  • Perfect visualization tool to present summaries for top management and stakeholders for presenting issues

Disadvantages:

  • Interrelationships or correlations between causes are not easily identifiable
  • No weight can be allocated to complex defects that might yield a lot of causes which might become visually cluttering

Adequate communication is essential in projects, in order to have truthful and accurate information exchange in order to ensure program managers or project managers are able to do rationally and correct decision making. For those individuals, who make the biggest impacts, have, what we call, a "high-performance mindset” and are always working with the latest update of professional project management templates to achieve their goals faster!

The Ishikawa diagram is created by Kaoru Ishikawa, and this diagram is also known as:

  • Fishbone diagram;
  • Herringbone diagram;
  • Cause-and-effect diagram;
  • Fishikawa diagram;
  • Root-cause analysis;
  • Cause-effect analysis.

The Ishikawa Diagram is commonly used for product design purposes or quality defect prevention to identify potential factors causing an overall effect. Each cause or reason for imperfection is a source of variation. Causes are usually grouped into major categories to identify and classify these sources of variation. It will help you achieve your goals by visualizing the important target and the supportive goals. The issue or defect is shown as the fish's head, facing to the east, with the causes extending to the left as fish bones; the ribs branch off the backbone for major causes, with sub-branches for root-causes, to as many levels as required.

This Excel spreadsheet is an interactive digital worksheet in tabular form and designed to organize information and perform calculations with scalable entries. It's not a matter of being a beginner or professional, from all over the world, are now using spreadsheets to create tables, calculations, comparisons, overviews, etc for any personal or business need. This useful worksheet in Excel will make the task a little easier and can be used for organization, analysis, accounting and storage of data in order to increase your productivity. This fishbone diagram template sheet in excel gives you a head start and is useful because it also has the basic formula’s included. If time and quality are of the essence, this worksheet can certainly help you out! 


Download this Fishbone Diagram Excel sheet directly to your computer, open it, modify it or print it directly. You'll see it is a great way to increase your productivity and to bring your task to a successful ending!


DISCLAIMER
Nothing on this site shall be considered legal advice and no attorney-client relationship is established.


Leave a Reply. If you have any questions or remarks, feel free to post them below.
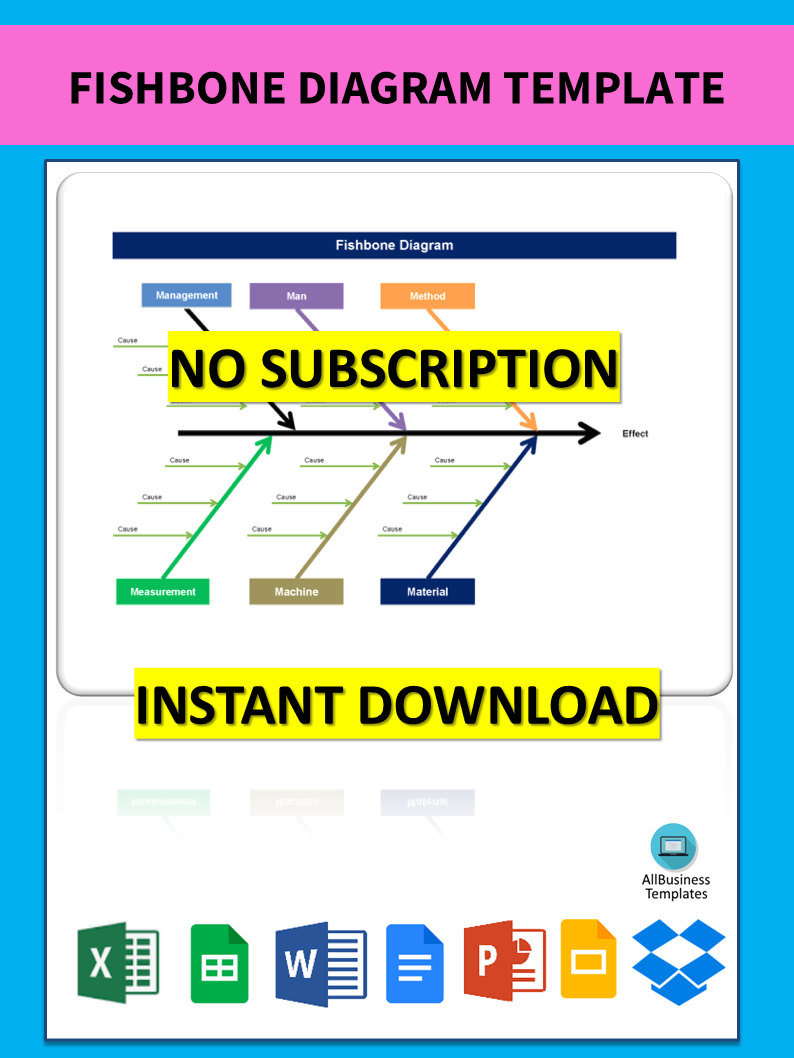

default user img

Diagram Fishbone

Fishbone diagrams help to group the causes are into major categories to identify and classify these sources of variation. Check out our Fishbone diagrams now.

Read more

One finds limits by pushing them. | Herbert Simon