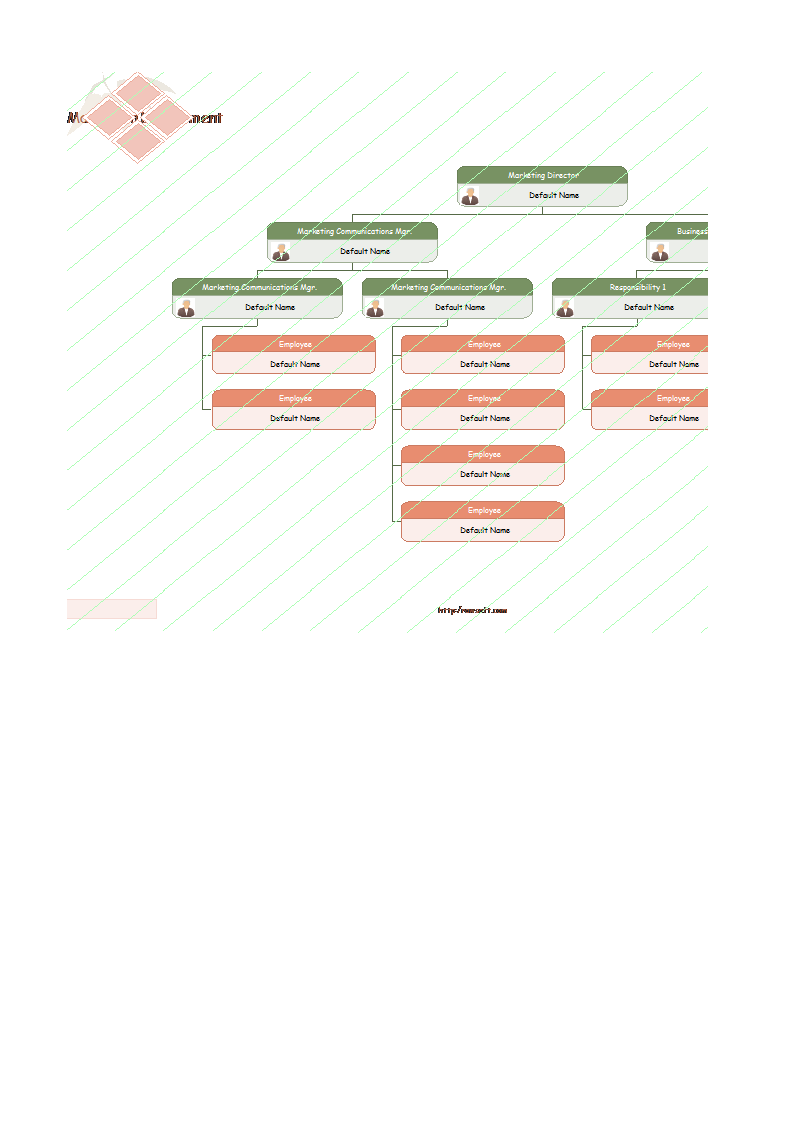
Organizational Chart Maker XLS sample
Sponsored Link免费模板 保存,填空,打印,三步搞定!

Download Organizational Chart Maker XLS sample
微软电子表格 (.xlsx)- 本文档已通过专业认证
- 100%可定制
- 这是一个数字下载 (39.93 kB)
- 语: English
Sponsored Link

How to create an Organizational Chart in Excel? Check out this easy-to-use Organizational Chart xlsx sample now!
How do I make an infographic?
As you assumed right, the word infographic comes from Information and Graphics. An Infographic is an overview or collection of imagery, charts, and minimal content that gives an immediate and easy-to-understand overview of a specific topic. They are effective because visual content works. In fact, the brain processes visual content a lot faster than it does text. Infographics are therefore a great way to explain complex information in a simple and concise way.
This Organizational Chart sample is a good example and can be easily used to make your own personalized Infographic. Infographics often consist of the following three parts: visual, content, and knowledge. The visual part consists of colors and graphics and is use striking, engaging visuals to communicate information quickly and clearly. There are two different types of graphics – theme, and reference. Theme graphics are included in all infographics and represent the underlying visual representation of the data.
How do you design an infographic?
- Plan your topic and infographic design
- Choose an infographic template to suit your specific needs
- Write an attractive and compelling title
- Create a grid or wireframe for your infographic design
- Use the right infographic layout for your data
- Follow data visualization best practices
- Incorporate different infographic design elements
- Use photography in your infographic design
How to Create an Infographic and Other Visual Projects in 5 Minutes in Excel?
- Check out the basic Infographic templates
- Configure your XLSX file
- Edit your information
- Add graphics via drag and drop from the template or other sources
- Insert data visualization—charts, maps or videos
- Save and export as XLSX or PDF and share with your audience
Check out our Infographic Templates and find many suitable Infographic Templates and Designs, or download this Organizational Chart Maker XLS sample now!
DISCLAIMER
Nothing on this site shall be considered legal advice and no attorney-client relationship is established.
发表评论。 如果您有任何问题或意见,请随时在下面发布
相关文件
Sponsored Link