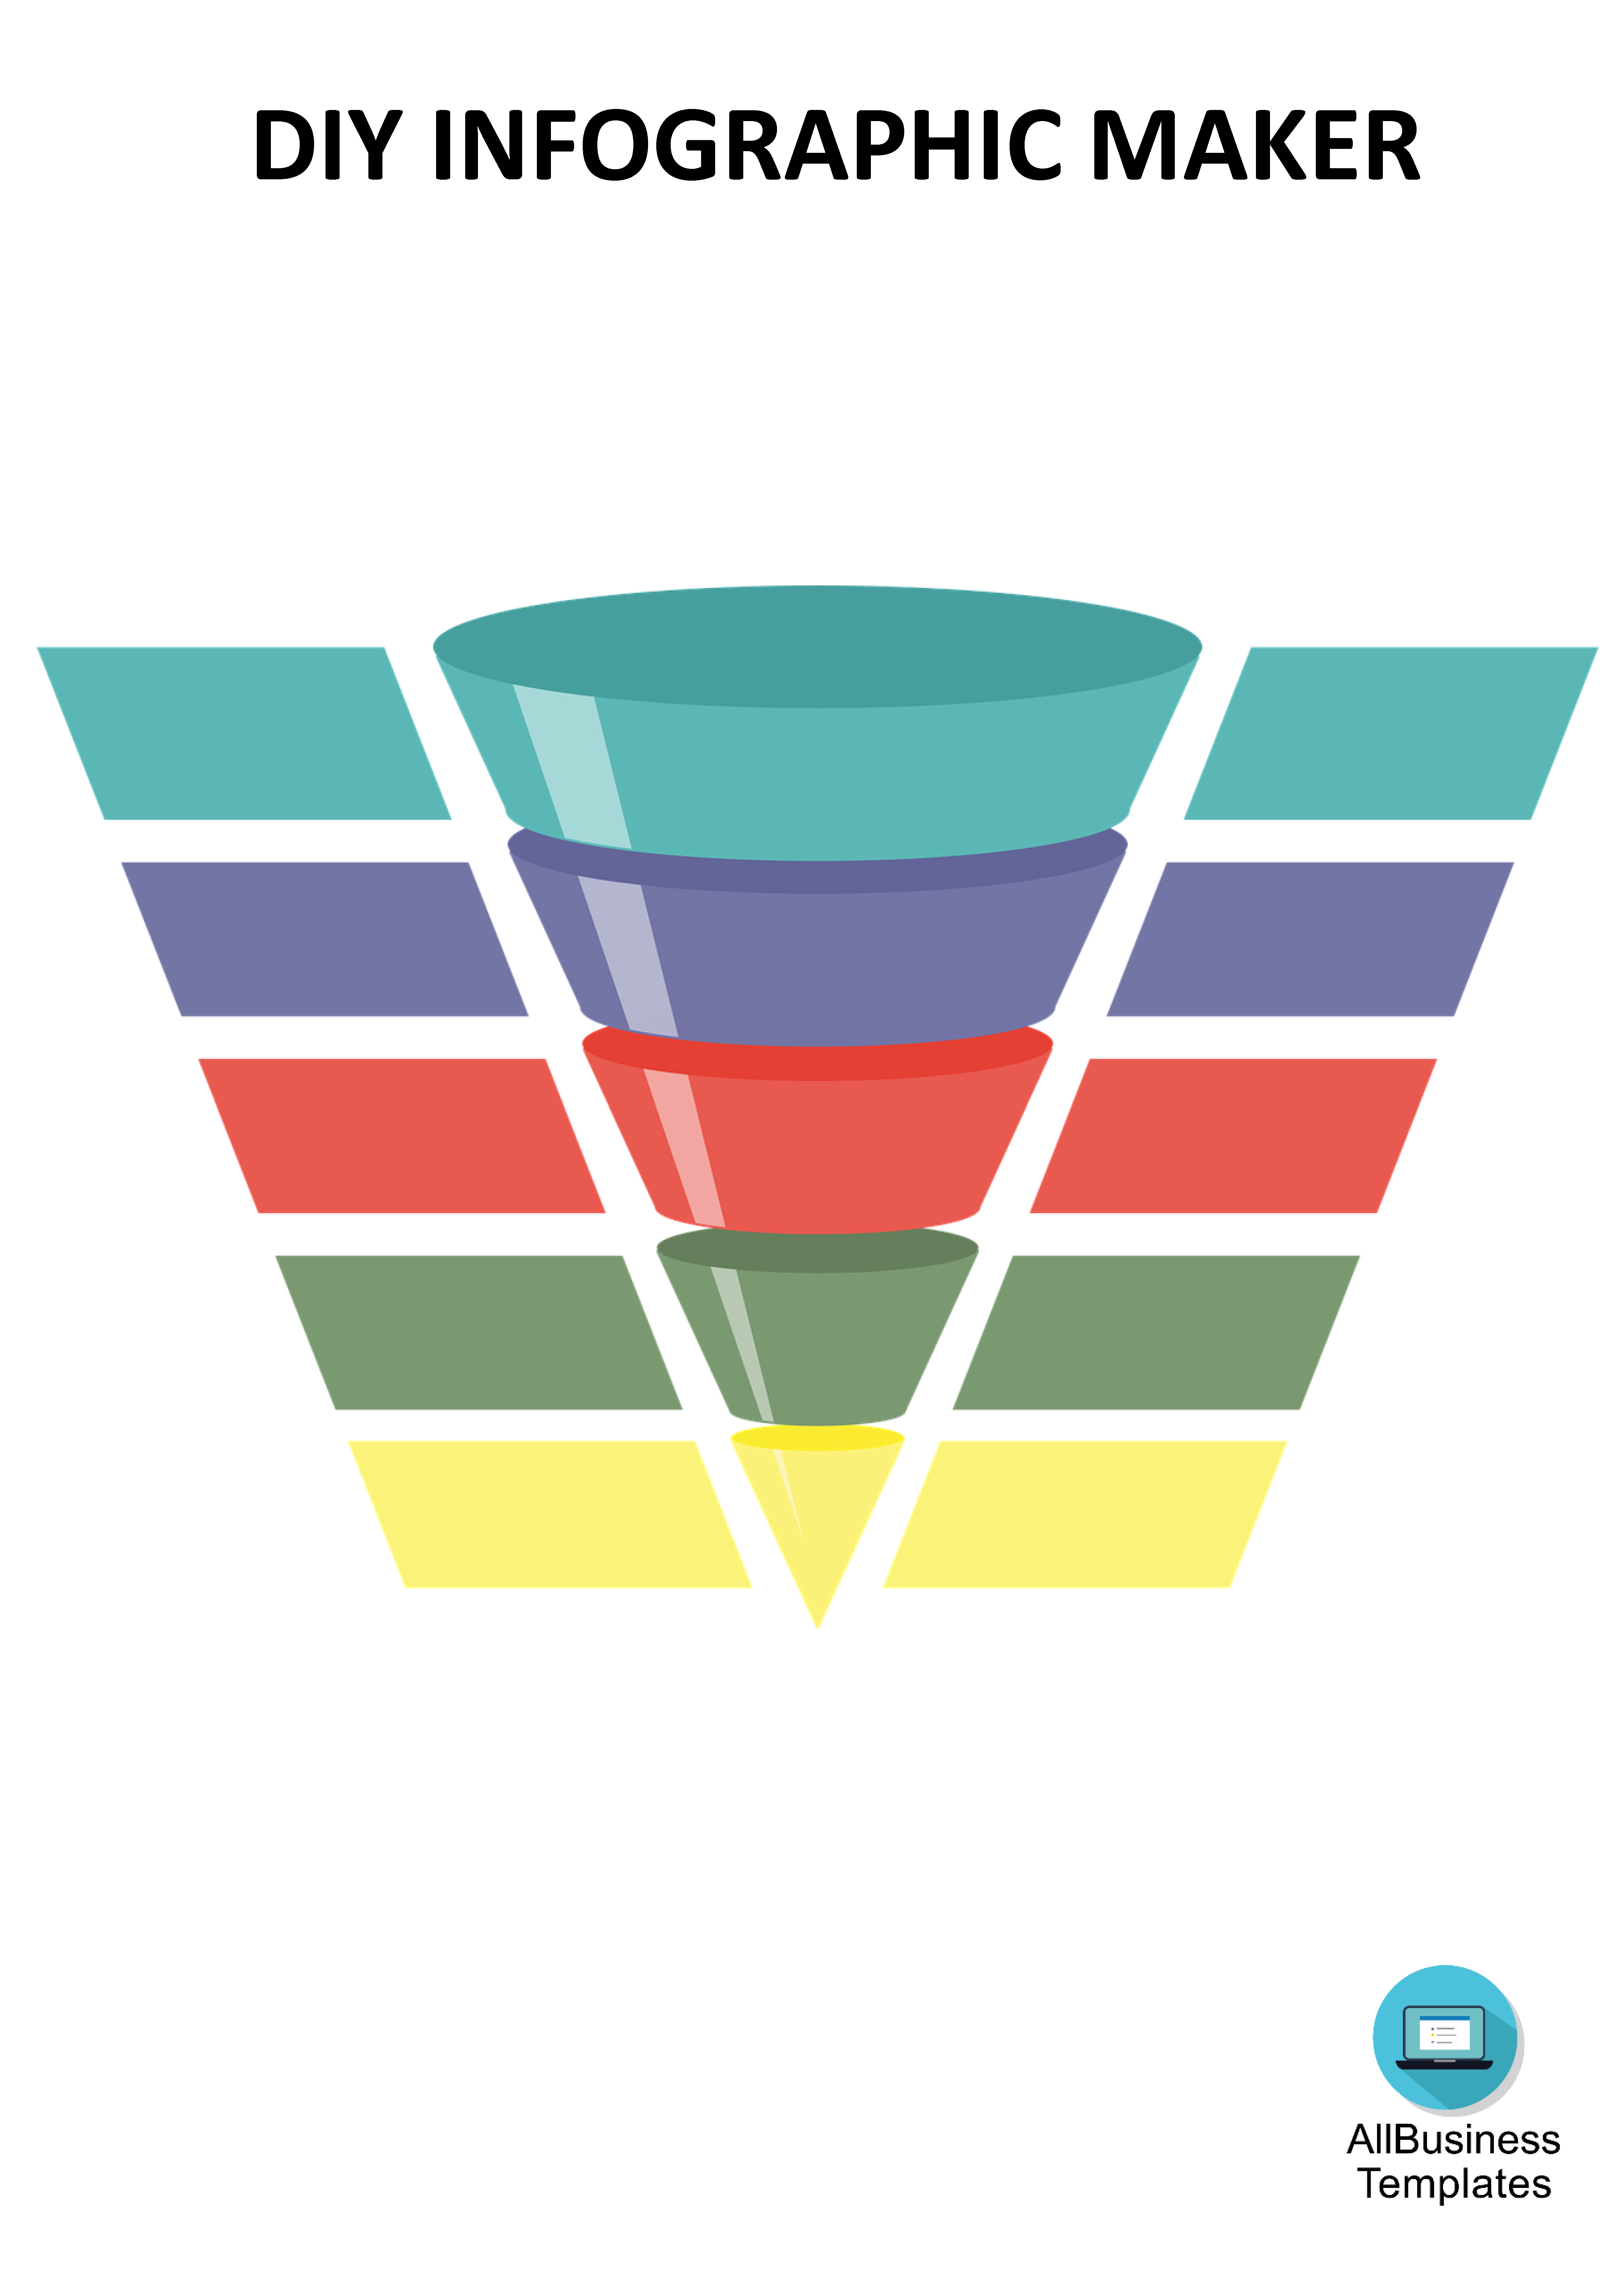
Infographic funnel chart
Save, fill-In The Blanks, Print, Done!

Download Infographic funnel chart
Today: USD 3.99
Download It Now

Available premium file formats:
(.pptx)- This Document Has Been Certified by a Professional
- 100% customizable
- This is a digital download (889.32 kB)
- Language: English
- You will receive a link to download the file as soon as your payment goes through.
- We recommend downloading this file onto your computer.
Are you looking for an Infographic funnel chart? Check out this easy-to-use Infographic funnel chart now and start promoting your business!
How do I make an infographic?
As you assumed right, the word infographic comes from Information and Graphics. An Infographic is an overview or collection of imagery, charts, and minimal content that gives an immediate and easy-to-understand overview of a specific topic. They are effective because visual content works. In fact, the brain processes visual content a lot faster than it does text. Infographics are therefore a great way to explain complex information in a simple and concise way.
This Infographic funnel chart is a good example and can be easily used to make your own personalized Infographic. Infographics often consist of the following three parts: visual, content, and knowledge. The visual part consists of colors and graphics and is use striking, engaging visuals to communicate information quickly and clearly. There are two different types of graphics – theme, and reference. Theme graphics are included in all infographics and represent the underlying visual representation of the data.
How do you design an infographic?
- Plan your topic and infographic design
- Choose an infographic template to suit your specific needs
- Write an attractive and compelling title
- Create a grid or wireframe for your infographic design
- Use the right infographic layout for your data
- Follow data visualization best practices
- Incorporate different infographic design elements
- Use photography in your infographic design
How to Create an Infographic and Other Visual Projects in 5 Minutes in PowerPoint or Word?
- Check out the basic Infographic templates
- Configure your PPTX or DOCX canvas
- Edit your information
- Add graphics via drag and drop from the template or other sources
- Insert data visualization—charts, maps or videos
- Save and export as PDF and share with your audience
Check out our Infographic Templates and find many suitable Infographic Templates and Designs, or download this Infographic template now!
DISCLAIMER
Nothing on this site shall be considered legal advice and no attorney-client relationship is established.
Leave a Reply. If you have any questions or remarks, feel free to post them below.
How do I make an Infographic?
Check out our collection of Infographic templates and find the right type and design to make your own personalized Infographic Template.
Read moreRelated templates
Latest templates
Latest topics
- Excel Templates
Where do I find templates for Excel? How do I create a template in Excel? Check these editable and printable Excel Templates and download them directly! - Blank Staff Paper
Are you in search of pristine music staff sheets to capture the essence of your new compositions? Check our free blank Staff Paper templates here. - Cornell Notes
What is Cornell note template? How do you structure Cornell notes? Check out these Cornell notes templates here. - GDPR Compliance Templates
What do you need to become GDPR compliant? Are you looking for useful GDPR document templates to make you compliant? All these compliance documents will be available to download instantly... - Easter Templates
What is the true meaning of Easter? Check out some fun facts about the Easter Bunny and download nice Easter templates here.
cheese
