T Chart PowerPoint
Speichern, ausfüllen, drucken, fertig!
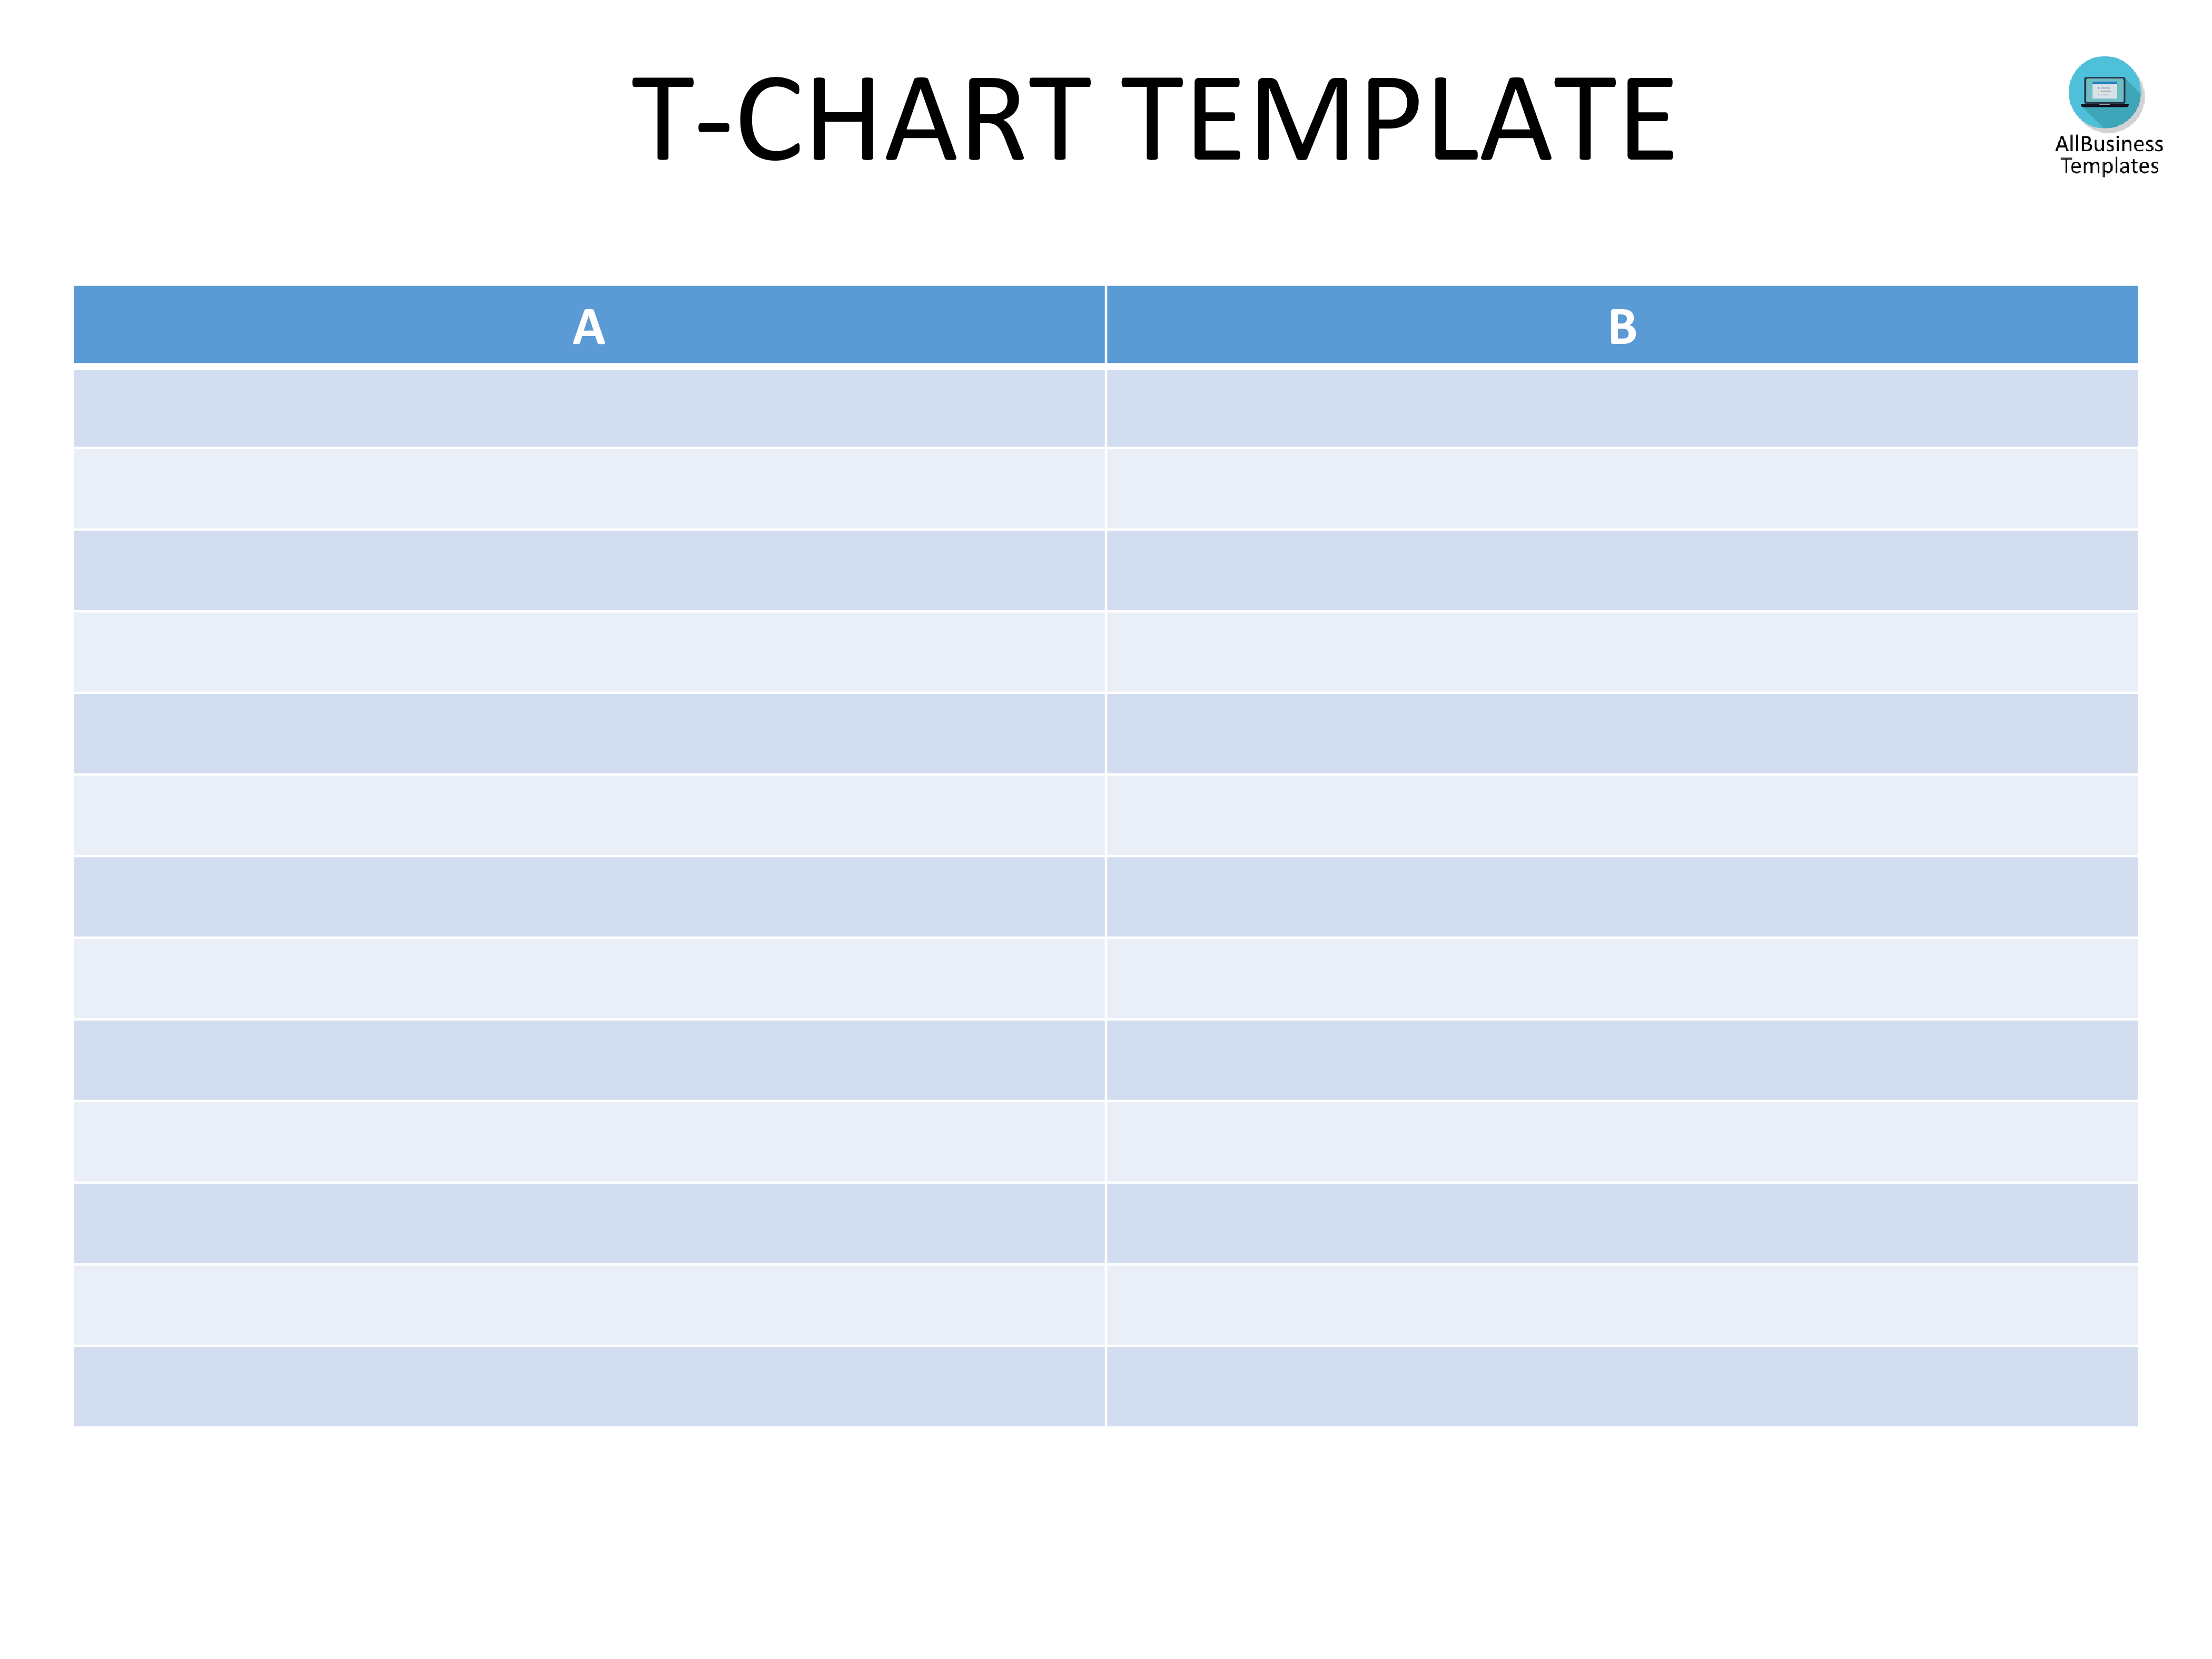
How do I create a T chart in Powerpoint? Check out this PPT full of T Chart templates that you can use for your own presentation.
Verfügbare Gratis-Dateiformate:
.pptx- Dieses Dokument wurde von einem Professional zertifiziert
- 100% anpassbar

Education Bildung t chart t Diagramm PowerPoint Power Point t chart excel t chart übertreffen t chart example t Diagramm Beispiel ppt pptx simple powerpoint templates Einfache PowerPoint Vorlagen powerpoint template PowerPoint Vorlage best PPT templates free download besten PPT Vorlagen zum kostenlosen Download professional PowerPoint templates free download Professionelle PowerPoint Vorlagen zum kostenlosen Download t chart template free
How do I create a T chart in Powerpoint? Check out this PPT full of T Chart templates that you can use for your own presentation.
We provide this T Chart PowerPoint PowerPoint template to improve your presentation. Our PowerPoint templates are regularly screened and used by professionals. If time or quality is of the essence, this ready-made presentation can certainly help you out!
A lot of people spend time and attention to detail in compiling amazing PowerPoint presentations that help explain their business. We have done lots of hard work all ready for you. We have an entire team of visual consultants & designers searching, designing, and optimizing PPTx templates for your convenience. Also, we have lots of donation presentation templates available online.
A T-Chart is perfect to make a comparison between two options (such as characteristics, specs, ideas, characters, events, etc.). By listing the topics as headings for the 2 columns, and writing down several characteristics that are valid for both options, it's easy to make a comparison. Here are some of the main uses of a T chart.
- Making a decision by comparing the pros and cons of any given situation.
- Planning an action by listing down the various problems and solutions.
- Comparing facts with opinions.
- Listing the strengths and weaknesses of a project.
- Breaking down personal or business' expenses and assets.
- T-charts are commonly used to make linear and/or quadratic comparisons in math.
- Discuss the characteristics of a specific topic.
- Lists problems and its corresponding solutions.
- Creates a comparison of the advantages and disadvantages.
- Lists opportunities and threats of a plan.
- Lists real facts vs fake facts.
- Compares personal traits and opposite characteristics of a personality.
- List down the positive and negative results or outcomes of processes.
- Any other variables that you want to compare.
How do you create a T Chart in PPTx?
- In your blank PPTX document, click Insert > Table;
- Select 2 columns and the number of records you need (for example: 2x8);
- Write down 2 variables as headers in the first line of the table;
- Enter your data into the table that automatically opens with the table.
- Alternatively: In your blank PPTX document, click Insert > Chart;
- Select the type of chart you want, such as 2 column chart;
- Enter your data into the table that automatically opens with the chart.
Actually, we have already created a set of T-charts in Powerpoint for you. This way we hope to help you becoming more effective and making your life a little easier! This page lists our most popular presentation templates. You can also download professionally designed .ppt and .pptx files to increase your productivity.
Here you find a large proportion of our collection of free and premium PowerPoint templates. Every template has a brief description with the download link. If you want to learn more about the templates, check it out now.
Using this T Chart PowerPoint makes life easier. You will see that finishing a strong presentation has never been easier!
Download this T Chart PowerPoint PPT now!
HAFTUNGSAUSSCHLUSS
Nichts auf dieser Website gilt als Rechtsberatung und kein Mandatsverhältnis wird hergestellt.
Wenn Sie Fragen oder Anmerkungen haben, können Sie sie gerne unten veröffentlichen.


