Gantt Chart Excel Template
Speichern, ausfüllen, drucken, fertig!
How to make a Gantt Chart in Excel? What is a Gantt chart? Download our Gantt chart Excel Template makes it easier than ever to create and manage your project timeline.
Preis: USD 2.59
Jetzt downloaden!
Verfügbare Premium-Dateiformate:
.xlsWeitere verfügbare Sprachen:
- Dieses Dokument wurde von einem Professional zertifiziert
- 100% anpassbar
Business Unternehmen gantt chart Gantt Diagramm Projectmanagement Projektmanagement gantt Gantt excel gantt Excel Gantt project management Projektmanagement project Projekt planning Planung free gantt chart Kostenloses Gantt Diagramm gantt bar chart Balkendiagramm project gantt Projekt Gantt gantt for project Gantt für das Projekt gantt chart projects Gantt Diagrammprojekte programma management Programmverwaltung programmamanagement Programmmanagement gantt bar chart excel Balkendiagramm Excel Gantt chart Excel Excel Gantt Diagramm how to create a gantt chart in excel So erstellen Sie ein Balkendiagramm in Excel excel gantt chart Excel Gantt Diagramm
How to make a Gantt chart in Excel? Are you looking for an effective strategic, tactical, and operational planning template such as the Gantt Chart Excel Template in order to improve your company's efficiency and effectiveness? Our Gantt Chart Excel Template makes it easier than ever to create and manage your project timeline. With an intuitive interface and powerful features, you can easily plan, track, and adjust your project. Download this Gantt Chart Excel template now!
What is the purpose of a Gantt Chart Excel Template?
A Gantt Chart Excel template is important for several reasons, especially in the context of project management. Here are some key reasons why using a Gantt Chart Excel template can be beneficial:
- Visual Representation: Gantt Charts provide a visual representation of the project schedule. This visual format makes it easier for project managers, team members, and stakeholders to understand the timeline, dependencies, and overall progress of the project.
- Task Planning and Sequencing: The template helps in planning and sequencing tasks by allowing you to list all the tasks involved in a project and arrange them in the order in which they need to be completed. This helps in organizing and structuring the project workflow.
- Timeline Management: Gantt Charts clearly display the timeline of the project, including start and end dates for each task. This helps in managing and tracking deadlines, ensuring that the project stays on schedule.
- Dependency Tracking: The Gantt Chart allows you to visualize task dependencies. You can easily identify which tasks are dependent on others and plan accordingly. This helps in understanding the critical path of the project and managing dependencies effectively.
- Resource Allocation: Gantt Charts assist in resource allocation by showing when specific resources are needed for each task. This is crucial for optimizing resource utilization and avoiding overloading team members.
- Communication Tool: Gantt Charts serve as a powerful communication tool. They provide a clear and concise way to communicate the project schedule to team members, stakeholders, and other relevant parties. This transparency fosters better collaboration and understanding.
- Progress Tracking: The Gantt Chart template allows you to track the progress of each task. As tasks are completed, the chart is updated, providing a real-time overview of project status. This helps in identifying delays or areas where additional resources may be needed.
- Project Coordination: Gantt Charts facilitate coordination among team members by providing a shared understanding of the project timeline and task responsibilities. Team members can refer to the chart to see what tasks they need to focus on and when.
- Documentation and Reporting: Gantt Charts can be used as documentation for project planning and as a basis for progress reports. They provide a historical record of the project schedule, which can be useful for future reference and analysis.
- Template Consistency: Using a Gantt Chart Excel template ensures consistency in project planning and presentation. This consistency can be particularly valuable in organizations where multiple projects are managed simultaneously.
Overall, a Gantt Chart Excel template is a valuable tool for project managers to plan, execute, and monitor projects effectively, providing a comprehensive and visually intuitive overview of project timelines and activities.
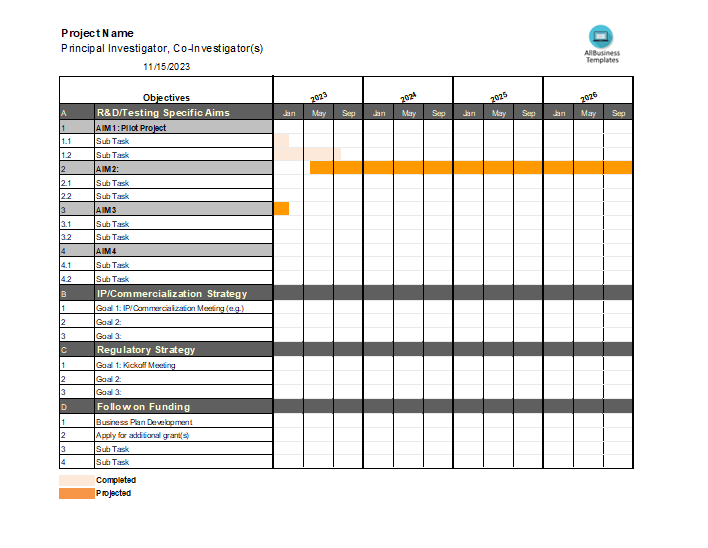
We provide a professional Excel Template to make a Gantt Chart. This famous bar chart illustrates and visualizes a work breakdown project schedule in one overview. This Gantt chart planning template is the perfect starting point to professionalize and streamline the current and upcoming projects in your company. It helps you to create the foundation and you just have to bring in your own data to make it a suitable document that you can share with your workers or colleagues.
What is a Gantt chart?
The Gantt chart is a bar chart or diagram that is used in the tactical planning of projects. A Gantt chart is composed of a number of rows. Each row represents a module or task within the project, performed by one or a group of owners.
Generally speaking, the modules are sorted in chronological order. The horizontal axis shows the time that is required for the overall project. For each module, the bar indicates the timeline that is required for the project. Complicated Gantt charts can also include milestones and relationships or liabilities between modules (for example Task A must be completed before task B can be started).
This ready-to-use Gantt Chart Excel template can help you out!
Try out our online Free and Premium Professional templates, forms and contracts today. Save, fill-In the blanks, print …and done!
HAFTUNGSAUSSCHLUSS
Nichts auf dieser Website gilt als Rechtsberatung und kein Mandatsverhältnis wird hergestellt.
Wenn Sie Fragen oder Anmerkungen haben, können Sie sie gerne unten veröffentlichen.


