Cash Flow Projection Chart
Speichern, ausfüllen, drucken, fertig!
How to create a Cash Flow Projection Chart? Download this Cash Flow Projection Chart template now!
Verfügbare Gratis-Dateiformate:
.pdf- Dieses Dokument wurde von einem Professional zertifiziert
- 100% anpassbar

Business Unternehmen Projectmanagement Projektmanagement cash Kasse Cost Kosten User Nutzer Year Jahr Charts Diagramme Farm Bauernhof Cash Flow Chart Cashflow Diagramm
Adequate communication is essential in order to finish projects successfully. In order to gain truthful and accurate information, you need to make sure that program- or project managers are able to make rational and correct decisions. For those who have, what we call, a "high-performance mindset”, we know they prefer to work with the latest update of professional project management templates, in order to achieve their goals faster. We are certain this Cash Flow Projection Chart will be of value.
Feel free to download this Cash Flow Projection Chart, or simply browse through our other basic or advanced template designs. They are intuitive and in several kinds of formats, such as PDF, WORD, XLS (EXCEL including formulas and can calculate sums automatically), etc.
Using this project management template guarantees that you will save time, cost and efforts and makes you more successful in your project, work and business!
Completing your Cash Flow Projection Chart was never simpler! Download this project management template now!
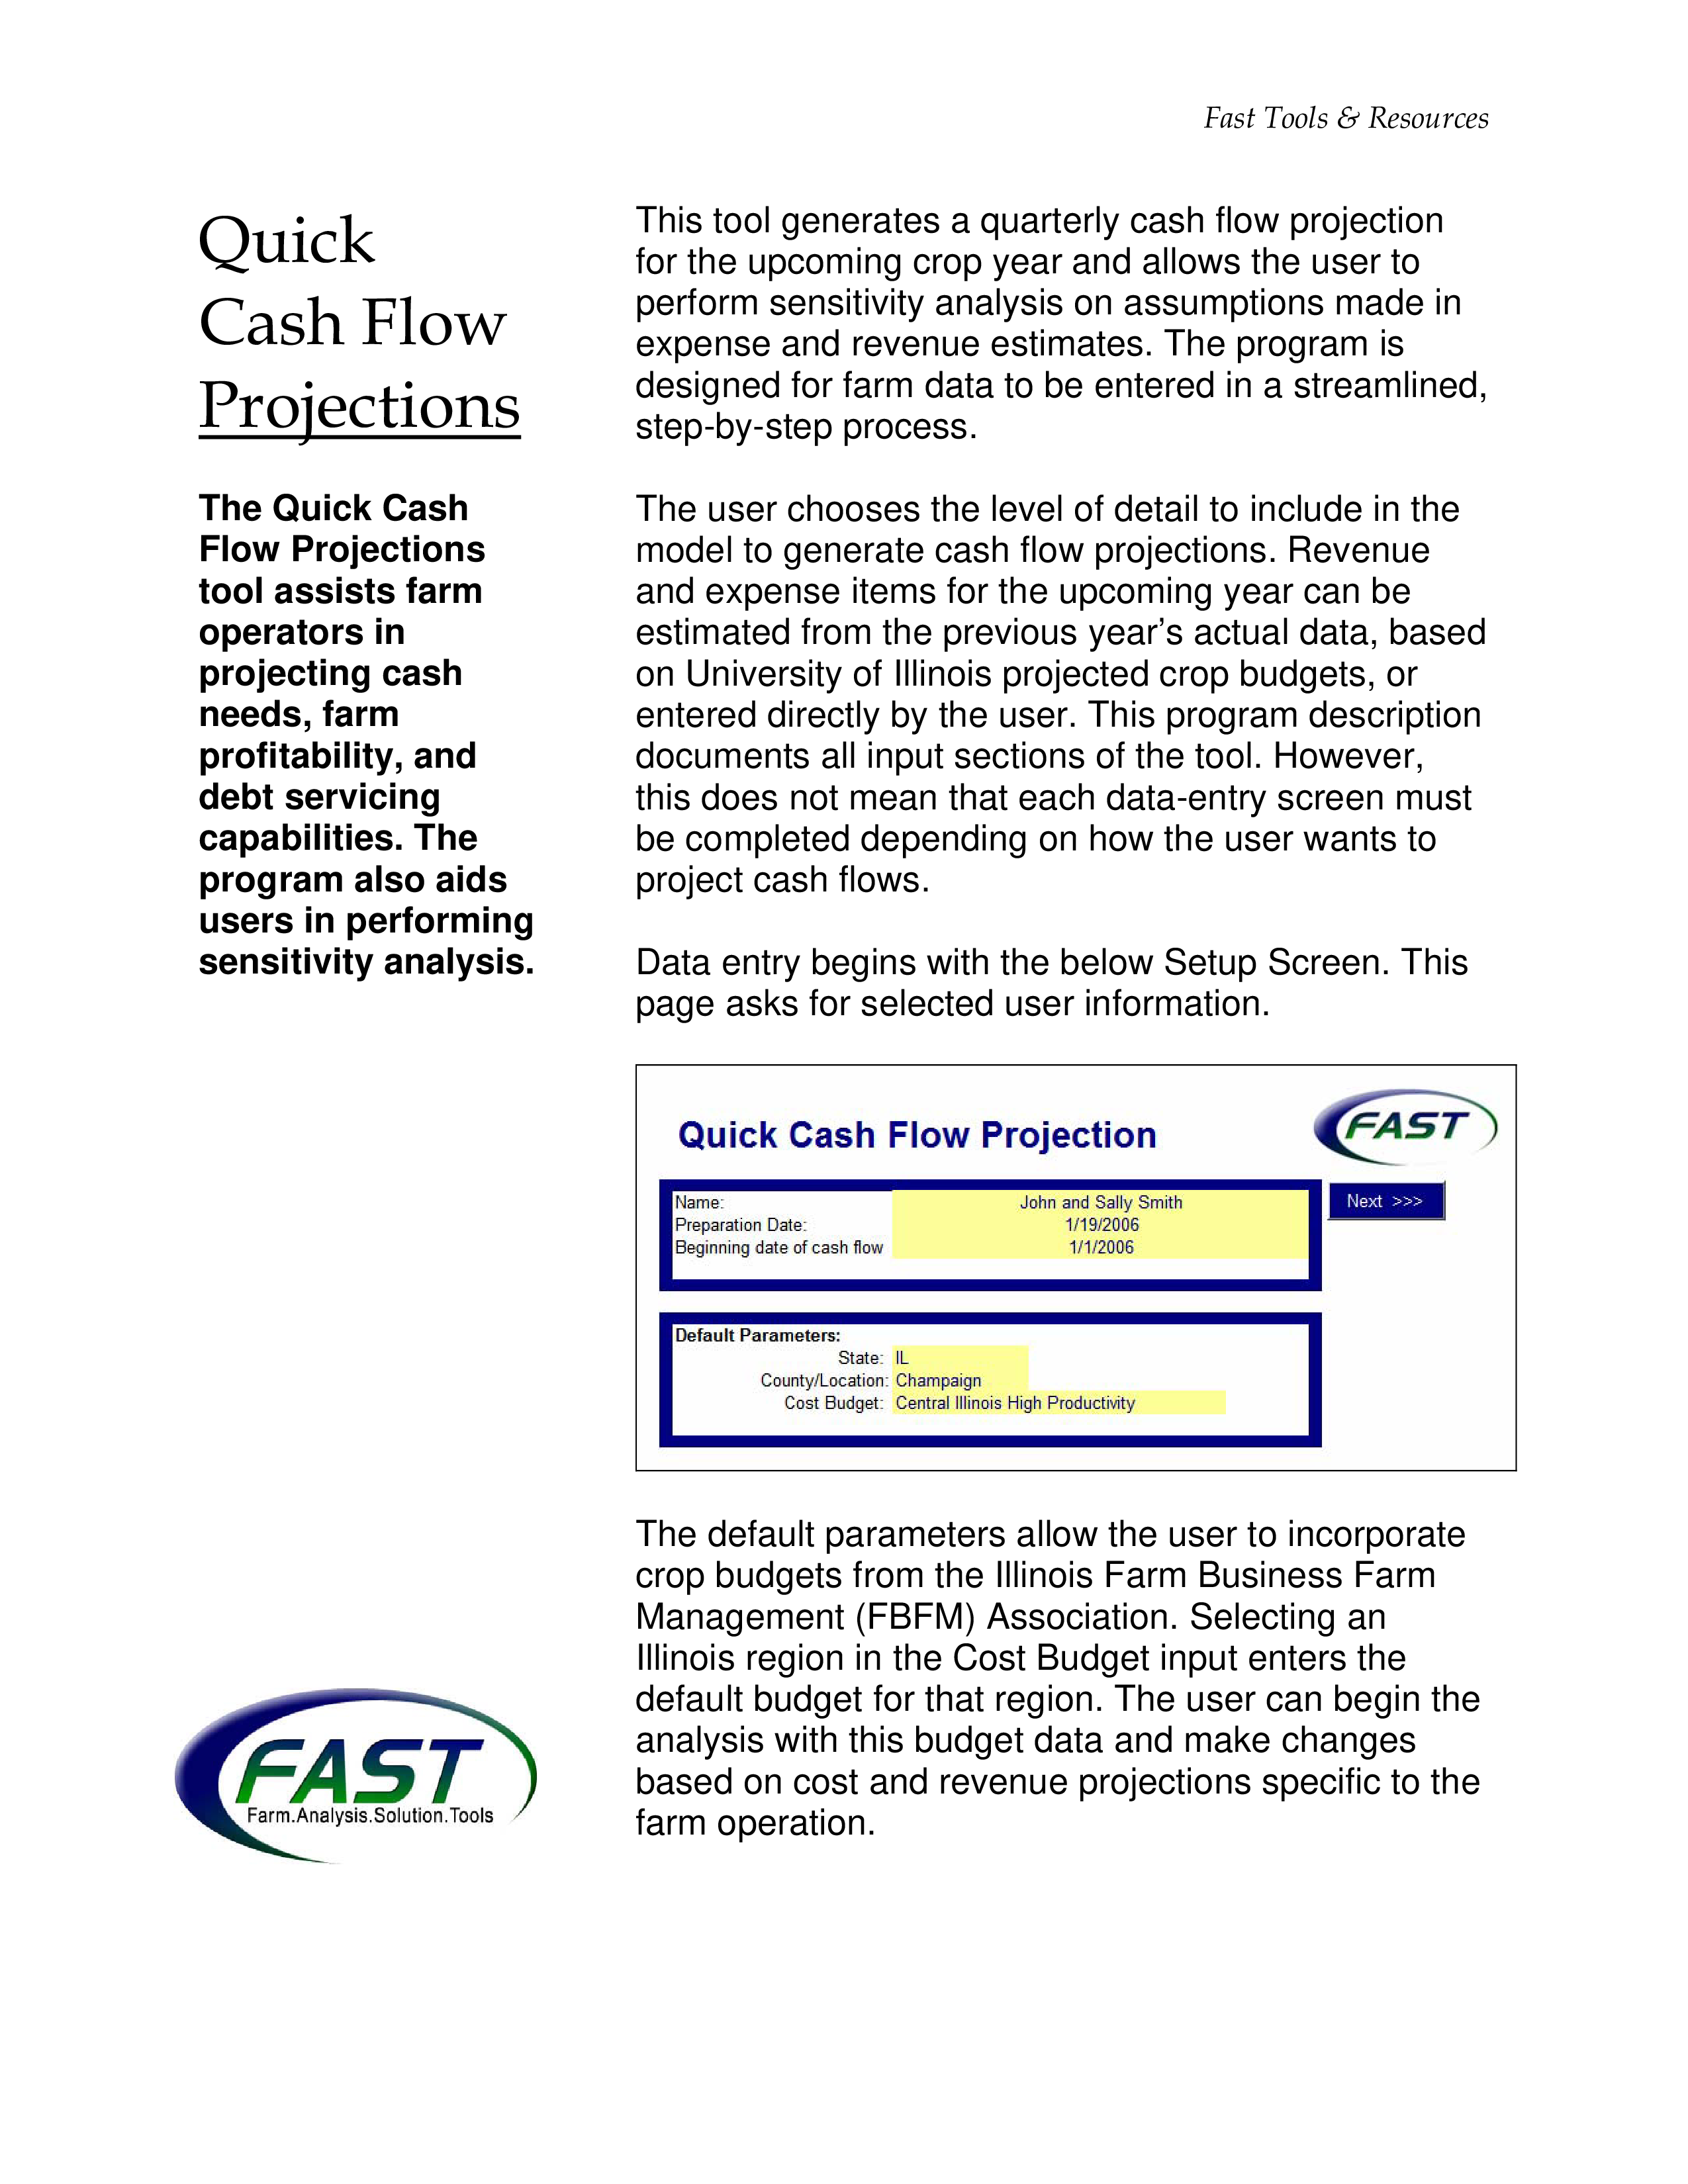
Fast Tools Resources Quick Cash Flow Projections This tool generates a quarterly cash flow projection for the upcoming crop year and allows the user to perform sensitivity analysis on assumptions made in expense and revenue estimates.. The top portion of the screen shot on the following page allows entry of beginning inventory - units (bushels remaining from the previous year’s crop), beginning inventory (the per-unit dollar value of that inventory), and the expected average price for each quarter of the upcoming year.. The Total Cost columns report prices or yields needed to cover all farm operating expenses, the Positive Income columns list prices or yields required to generate a positive net income, and the Positive Cash Flow columns state the prices or yields needed to meet all financial obligations for the farm business.. Cash Flow Graphs The model generates four graphs for analysis: - Proportion of value of farm production - Source of funds - Uses of funds - Operating loan balance Fast Tools Resources Sensitivity Analysis The tool allows the user to conduct in-depth sensitivity analysis on the assumptions made in the cash flow projection.. The above example shows three possible outcomes: - Scenario 1: 1 in 4 year yield decline - Scenario 2: 1 in 10 year yield decline - Scenario 3: 1 in 20 year yield decline To change farm expenses and income, enter the percent increase or decrease in the Change column..
HAFTUNGSAUSSCHLUSS
Nichts auf dieser Website gilt als Rechtsberatung und kein Mandatsverhältnis wird hergestellt.
Wenn Sie Fragen oder Anmerkungen haben, können Sie sie gerne unten veröffentlichen.


