Diagrama de Gantt Excel plantillas. página 3 | plantillas, contratos y formularios.
What is a Gantt chart and how to make one in Excel or Google Sheets?
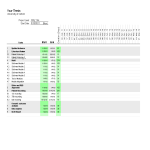
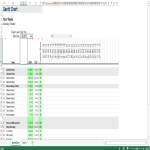
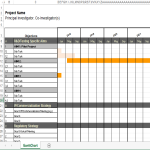
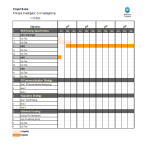
Gantt charts are project management tools that help you visualize timelines for your projects. The left column contains the project tasks to be completed, and the top row displays the dates. Each task's duration is represented by a bar, so you can see at a glance when it starts and ends. It is one of many project management tools. They represent all tasks of a project in one graph. They show the order in which tasks should be completed and the time required to complete them. This is valuable information for project management for the following reasons:
To meet the demands of modern software development, roadmap tools like Jira Software include features like collapsible task structures and resource management panels. Despite the iterative nature of the software development process, these roadmap tools help teams maintain a consistent project strategy.
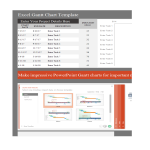
The power of a Gantt Chart, is that it’s easy to understand due to their visual representations of progress and data. A very useful tool and it comes in Excel (Gantt.xlsx) for different tasks like Gantt Bar Chart to understand planning of a project or company. Easy to use documents in XLS, format and can be used in almost every segment like business, project management, defense, studies, Strategy & Planning, policy making, Management, Organization, Performance, etc. etc.!
We provide instant access to several Gantt chart Excel templates to help you out. From elementary school student to CEO of a multinational, Gantt charts are unavoidable tools for almost everybody. A Gantt chart is a graphical representation or organizer of data and very effective, among the best, project management planning tools to plan a project work breakdown structure in such a way that it can be executed by one person or one team together. A Gantt chart is a specific bar chart type, which is created by Henry Gantt in 1910 and it outlines a project schedule in a visual way. Gantt charts outline the beginning and completion dates of the elementary components and deliverables of a project. The total of all elementary project components can be called "the work breakdown structure of the project".
AllBusinessTemplates.com understands the importance of strong communication in order to achieve your personal and company goals, therefore we collected lots of quality Gantt chart templates for your convenience. These Excel Gantt Charts will help you and your team to reach the next level of success in your work, education, and business. You can check out the following Top Gantt Chart templates: