Printable Gantt Chart Excel spreadsheet
Guardar, completar los espacios en blanco, imprimir, listo!
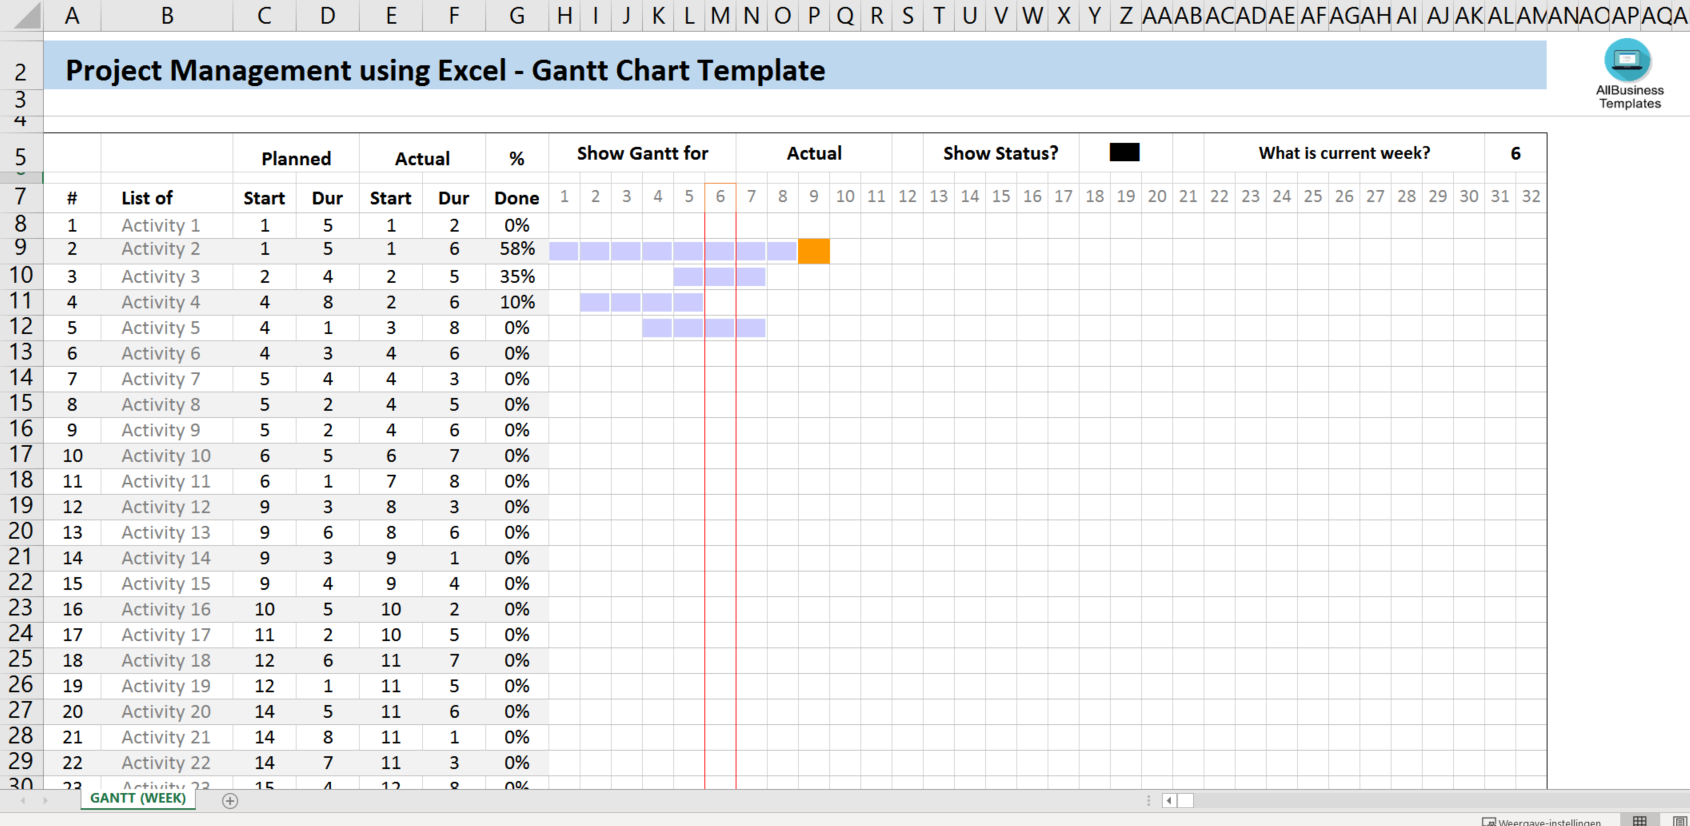
How to create a Gantt Chart in Excel? Is it possible to turn an Excel spreadsheet into a Gantt chart? Download our sample template now which can be use to create a Gantt Chart in Excel using a simple template.
Formatos de archivo disponibles:
.xlsxOtros idiomas disponibles::
- Este documento ha sido certificado por un profesionall
- 100% personalizable

Business Negocio gantt chart Gráfico de gantt gantt Gantt gantt chart free gantt chart gratis Excel Gantt chart Excel Diagrama de Gantt Excel gantt diagram diagrama de Gantt wat is een gantt diagram excel gantt diagram diagrama de excel gantt Activity Actividad Chart Gráfico Spreadsheet Hoja de cálculo Actual Real excel gantt chart gantt chart template in excel plantilla de diagrama de Gantt en Excel Gantt Chart Example Ejemplo de diagrama de Gantt Excel spreadsheet hoja de cálculo de Excel gantt chart in excel Excel template Excel modelo Excel templates for business best excel templates mejores plantillas de excel project management excel templates gestión de proyectos Excel plantillas xls xlsx template Excel spreadsheet plantilla de hoja de calculo Excel gantt chart template in excel spreadsheet gantt chart template in excel sample gantt chart template in excel template gantt chart template excel gantt chart template word copy export to csv people also search for gantt chart online gantt chart google sheets pert chart gantt pronunciation what is a gantt chart important gantt chart headings henry gantt gantt chart template google sheets gantt chart template word doc simple gantt chart excel gantt chart template ppt vertex 42 simple gantt chart what to include in a gantt chart gantt charts in excel gantt chart pronunciation gantt chart pdf advantages and disadvantages of gantt chart gantt chart pronounce gantt chart microsoft hourly gantt chart gantt chart slideshare gantt charts gantt chart maker what is a gantt chart gantt diagram uitblinken gantt diagramsjabloon gantt diagrammen gantt grafiekmaker gantt diagram google bladen gantt diagram excel sjabloon voorbeeld van een gantt diagram
How to create a Gantt Chart in Excel? Is it possible to turn an Excel spreadsheet into a Gantt chart?You can easily create a Gantt Chart in Excel using a simple template. Just download the template, enter your project data, and the chart will be generated automatically.
A Gantt chart is one of the most popular scheduling tools in project management. It’s a horizontal bar chart that shows progress on a project schedule. Tasks are arrayed on the vertical axis while the horizontal axis represents time. Tasks may be rolled up into summary elements, which constitutes a number of subtasks and represents a phase of project work.
What are the key benefits of using a Gantt Chart?
The charts are popular because they pack a large amount of information into an easily understandable, intuitive, and widely accessible format. They provide a clear view of project status and can even be used as a workable substitute for the project’s master schedule since they can contain everything you need to know about project tasks, resource requirements, and task dependencies. Even for people who aren’t trained as project managers, Gantt charts make it easy to understand how and when project tasks flow into each other. Here are some additional benefits of using Gantt charts:
- Promote detailed planning. Simply listing tasks forces project managers to break work down into chunks and understanding task dependencies requires granular knowledge of how a project is meant to proceed. Pinning down expected completion dates lead project teams to think carefully about resource requirements.
- Help to visualize the project schedule. A project’s critical path is the longest continuous sequence of tasks that effectively determines the duration of a project.
- Surface potential resource risks. On a technical level, Gantt charts help avoid resource overload, provide a basis for schedule accountability, and help identify where cost and duration can be reduced. Further, these charts can help identify potential problems such as if resources have been double-assigned, where staff are overscheduled, and when delays might affect the critical path.
- Improve project communications. On a human level, Gantt charts simplify the process of communicating the project plan and help keep everyone on the same page with little effort. They make the project’s planned progress easy for team members to visualize, providing both clarity and motivation to meet deadlines.
There are also advanced use cases for Gantt charts, outside of run-of-the-mill planning and scheduling. These scenarios include the following:
- Allocating resources across multiple simultaneous projects;
- Planning iterations for software development sprints;
- Comparing planned versus actual timelines on a project.
This spreadsheet is an interactive digital worksheet in tabular form and designed to organize information and perform calculations with scalable entries. It's not a matter of being a beginner or professional, from all over the world, are now using spreadsheets to create tables, calculations, comparisons, overviews, etc for any personal or business need. A Gantt chart is a very popular planning tool that is often used to manage projects and to provide to the management/project board a status update.
Often, such a planner chart tool consists of just four basic components, like:
- activity names (description of the task or activity);
- activity bars (the start date and lead time for the task or activity)
- milestones (milestone marks the end of a piece of work or phase of the project. They are often fixed dates with or important dates that you need to be aware);
- dependencies, overlap, and link with other activities. Activities that can only start and finish, or are directly impacted, if another task is finished before them. Therefore it’s common to add a number in the column This is often an easier way of quickly finding out which task links where. Use the numbers in this column to track back the task dependencies, it can be faster than trying to trace a spidery line on the Gantt chart.).
This useful planner worksheet will make all your tasks a little easier and can be used for organization, analysis, accounting, and storage of data in order to increase your productivity. This Gantt Chart Template in excel gives you a head start and is useful because it also has the basic formula’s included. If time and quality are of the essence, this worksheet can certainly help you out!
Download this printable Gantt Chart Excel spreadsheet directly to your computer, open it, modify it, or print it directly. You'll see it is a great way to increase your productivity and to bring your task to a successful ending!
DESCARGO DE RESPONSABILIDAD
Nada en este sitio se considerará asesoramiento legal y no se establece una relación abogado-cliente.
Deja una respuesta. Si tiene preguntas o comentarios, puede colocarlos a continuación.


