Scatter Plot Diagram Example
I-Save, punan ang mga blanko, i-printa, Tapos na!
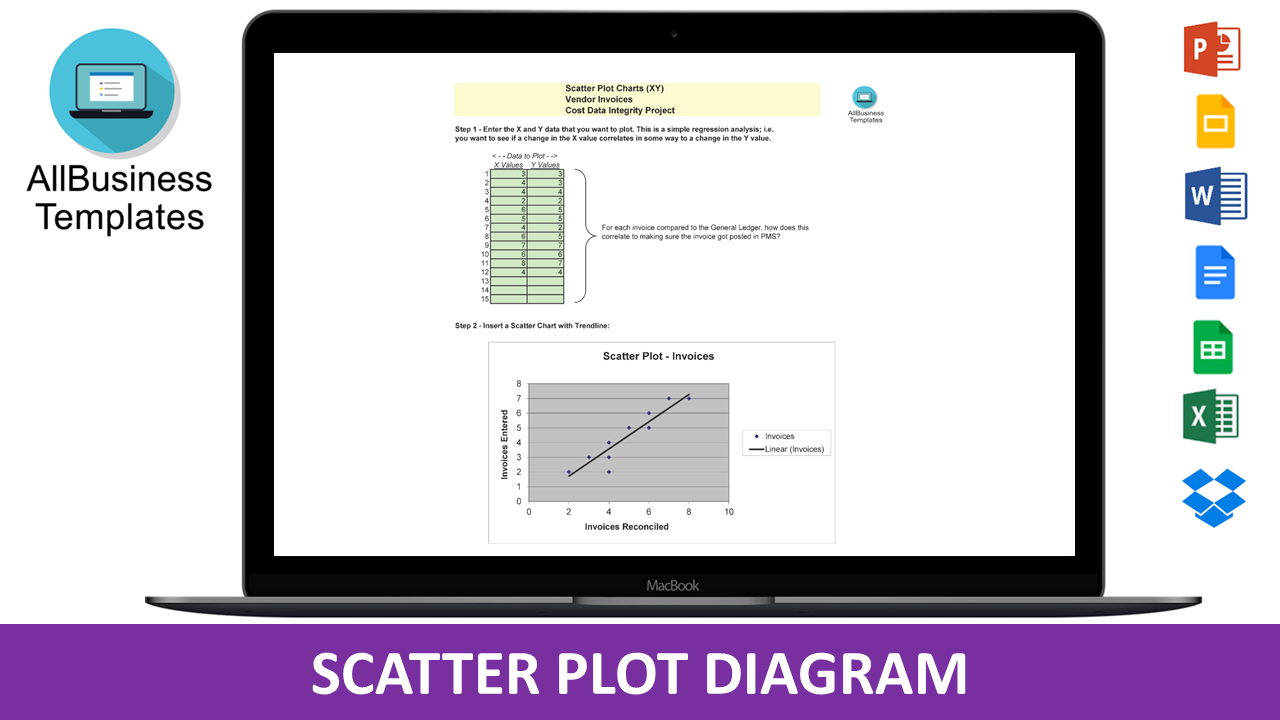
What is a scatter plot, and how would you describe one? What is the purpose of a scatter plot diagram? Download this example template contains all the necessary elements to create a scatter plot diagram.
Mga magagamit na premium na format ng file:
.xls- Itong dokumento ay sertipikado ng isang Propesyonal
- 100% pwedeng i-customize

Projectmanagement Proyekto ng Pagkontrol mathematics statistics data Data Analysis Statistical Analysis Statistical Methods Six Sigma Green Belt Project Step Plot Ang plot Multivariate Statistics
What is a scatter plot, and how would you describe one? What is the purpose of a scatter plot diagram? This example template contains all the necessary elements to create a scatter plot diagram. It has two axes, a scatter plot and a trend line. Download this template now which also outlines how to customize and customize the diagram.
This template is designed to make it easy to create visually appealing and informative scatter plots. With a range of customization options and customization options, this template is perfect for showcasing data relationships, patterns, and trends.
Key Features
- Customizable Data Markers
- The scatter plot template offers a range of customizable data markers, allowing you to choose different shapes, colors, and sizes to represent your data. This flexibility allows you to tailor your scatter plot to your specific needs and ensure that your data is clear and easy to understand.
- Intuitive Interface
- The scatter plot template features a user-friendly interface, making it easy to create and customize scatter plots without the need for extensive technical knowledge. Simply drag and rearrange data markers, adjust the axis labels, and add titles and labels to create a professional-looking scatter plot.
- Multiple Chart Types
- In addition to scatter plots, this template also supports various other chart types, such as line charts, bar charts, and pie charts. This versatility allows you to combine different types of data and present a comprehensive picture in an engaging and visually compelling manner.
- Export and Sharing Options
- Once you have created your scatter plot, you can easily export it in various formats, including PDF, PNG, and SVG. Additionally, you can share your scatter plot with colleagues, clients, or a wider audience through popular social media platforms or websites.
- Free and Open Source
- The scatter plot template is free to use and open source, meaning that anyone can access it and contribute to its further development. This accessibility ensures that your scatter plot remains flexible and adaptable to changing needs, allowing you to create visualizations that accurately reflect your data.
In conclusion, our scatter plot diagram example template is a valuable tool for creating visually appealing and informative scatter plots. With its customizable features, user-friendly interface, and multiple chart types, this template is perfect for showcasing data relationships, patterns, and trends. Whether you're a student, researcher, or professional, this template will help you effectively communicate your data through scatter plots.
Click directly on 'Open with Google Docs' or download our sample scatter plot diagram template as a Word template now to enhance efficiency! Your success in delivering a well-structured and effective plot diagram awaits.
DISCLAIMER
Wala sa 'site' na ito ang dapat ituring na legal na payo at walang abogado-kliyenteng relasyon na itinatag.
Mag-iwan ng tugon. Kung mayroon kang anumang mga katanungan o mga komento, maaari mong ilagay ang mga ito sa ibaba.


