Organizational Chart Infographic Excel
I-Save, punan ang mga blanko, i-printa, Tapos na!
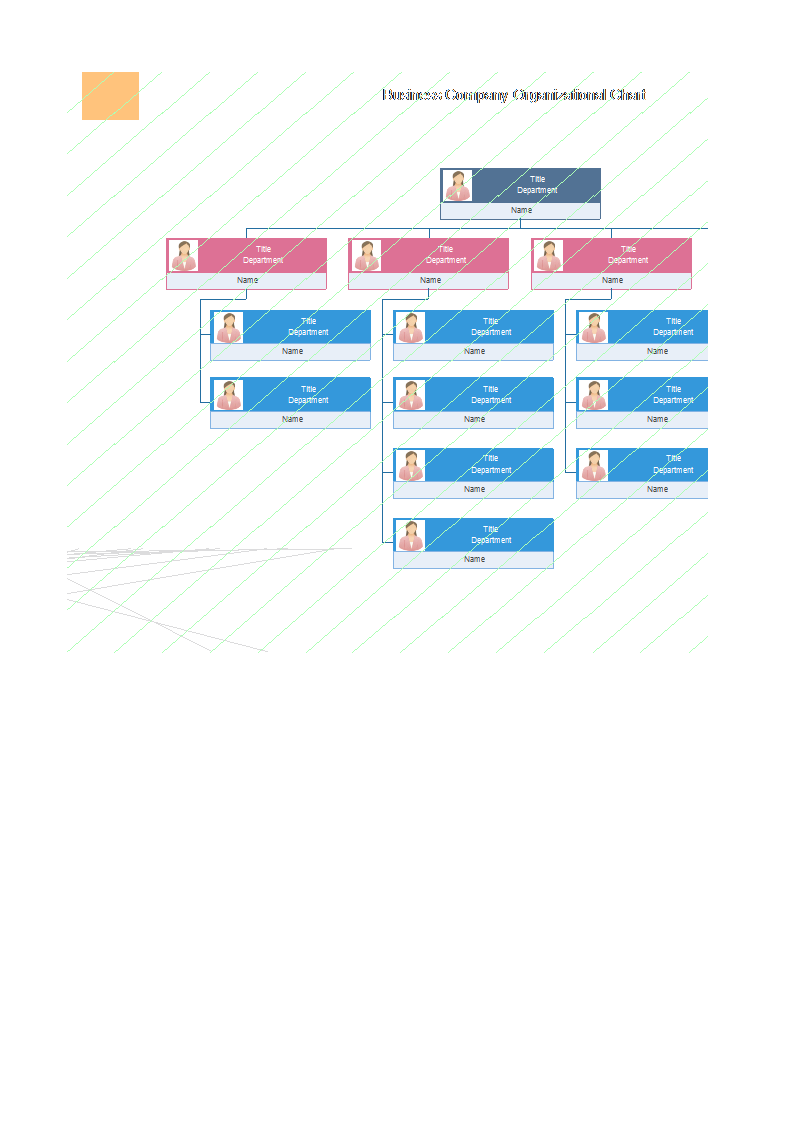
Are you looking for an Organizational Chart in Excel? Check out this easy-to-use Organizational Chart infographic sample now! For instructions, see Create an Excel organization chart.
Mga magagamit na premium na format ng file:
.xlsx- Itong dokumento ay sertipikado ng isang Propesyonal
- 100% pwedeng i-customize

Business Negosyo HR Excel Chart Spreadsheet Organizational Organizational Chart Sample Organizational Chart Excel spreadsheet spreadsheet ng Excel Excel template Excel templates for business best excel templates project management excel templates xls xlsx template Excel spreadsheet template ng Excel spreadsheet organizational chart sample spreadsheet organizational chart sample sample organizational chart sample template org chart organogram template template ng organogram what is an organogram ano ang organogram organogram maker gumagawa ng tsart ng organisasyon organogram Word organogram na Salita types of organogram organogram or organigram tsart ng organisasyon o tsart ng organisasyon
Are you looking for an Organizational Chart in Excel? Check out this easy-to-use Organizational Chart infographic sample now!
If you are looking for a tool to visualize the reporting relationships within an organization or company, make use of this Excel graphic spreadsheet that uses an organization chart layout.
How do I make an infographic?
As you assumed right, the word infographic comes from Information and Graphics. An Infographic is an overview or collection of imagery, charts, and minimal content that gives an immediate and easy-to-understand overview of a specific topic. They are effective because visual content works. In fact, the brain processes visual content a lot faster than it does text. Infographics are therefore a great way to explain complex information in a simple and concise way.
This Organizational Chart sample is a good example and can be easily used to make your own personalized Infographic. Infographics often consist of the following three parts: visual, content, and knowledge. The visual part consists of colors and graphics and is use striking, engaging visuals to communicate information quickly and clearly. There are two different types of graphics – theme, and reference. Theme graphics are included in all infographics and represent the underlying visual representation of the data.
How do you design an infographic?
- Plan your topic and infographic design
- Choose an infographic template to suit your specific needs
- Write an attractive and compelling title
- Create a grid or wireframe for your infographic design
- Use the right infographic layout for your data
- Follow data visualization best practices
- Incorporate different infographic design elements
- Use photography in your infographic design
How to Create an Infographic and Other Visual Projects in 5 Minutes in Excel?
- Check out the basic Infographic templates
- Configure your XLS or XLSX canvas
- Edit your information
- Add graphics via drag and drop from the template or other sources
- Insert data visualization—charts, maps or videos
- Save and export as XLSX or PDF and share with your audience
For instructions, see Create an Excel organization chart. Check out our Infographic Templates and find many suitable Infographic Templates and Designs, or download this Infographic template now!
DISCLAIMER
Wala sa 'site' na ito ang dapat ituring na legal na payo at walang abogado-kliyenteng relasyon na itinatag.
Mag-iwan ng tugon. Kung mayroon kang anumang mga katanungan o mga komento, maaari mong ilagay ang mga ito sa ibaba.


