Square Root Curve


How to make a Square Root Curve Chart? Seeking a reliable Square Root Curve chart to create your chart effortlessly? 

Explore our downloadable graph template, designed for straightforward and efficient chart creation. Start today and experience the ease of charting with our user-friendly template. A Square Root Curve Chart graphically displays data, employing a logarithmic scale for the dependent variable and a square root function for the independent variable. This method is particularly useful for depicting non-linear relationships where data exhibits high variability or standard deviation.

Purpose and Utility:

Square Root Curve Charts are instrumental in statistics, physics, and engineering for visualizing complex relationships and analyzing data trends in a non-linear format.

Chart Details:

  • Horizontal Axis: Represents the independent variable (often time).
  • Vertical Axis: Depicts the dependent variable.
  • Data Representation: Data points are plotted with x-values on a logarithmic scale and y-values derived from a square root function.

Interpreting the Chart:

  • Negative Relationship: A downward sloping curve suggests that as one variable increases, the other decreases.
  • Positive Relationship: An upward sloping curve indicates that both variables increase together.
  • Flat Curve: Implies a weak or nonexistent relationship between the variables.
  • Peaks and Troughs: These features can highlight significant events or trends within the dataset.
  • Standard Deviation: The square root function correlates with the data's standard deviation, indicating the variability level.

Efficiency in Usage:

These Square Root Curve templates are not only facilitates the creation of Square Root Curve Charts but also standardizes the process, making your work more professional. Ideal for repetitive tasks, it helps maintain consistency and quality across projects. Whether you're tackling daily tasks or unique projects, this template saves time and ensures focus on critical aspects of your work.

Download below our Square Root Curve Charts and streamline your data visualization process!

 
Vorschaubild der VorlageSquare Root Curve Chart

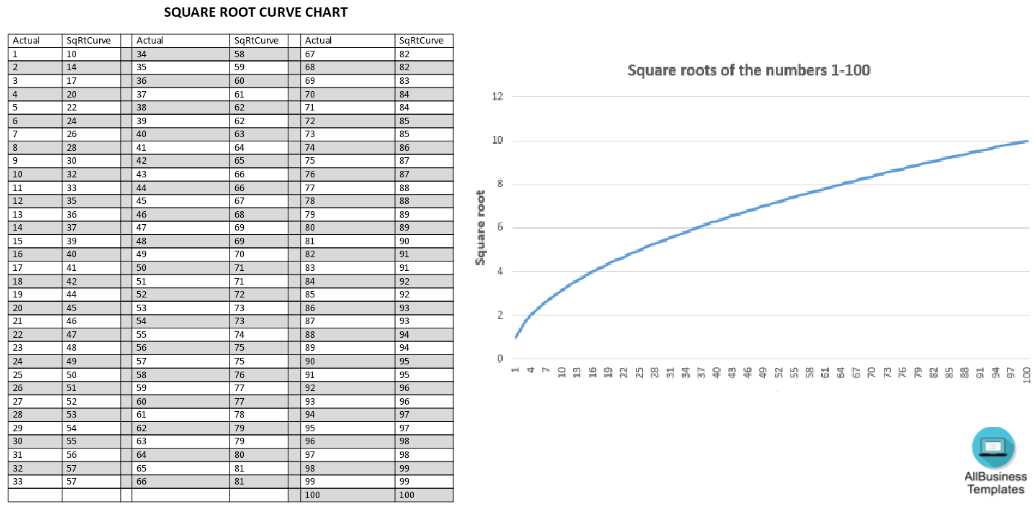
Square Root Curve Chart

How to draft a Square Root Curve Chart? Are you in search of a square root curve chart template? Here you will find a graph template you can use to create a square root curve chart.

file format: .docxView template
Vorschaubild der VorlageSquare Root Number Chart

Square Root Number Chart

How to create a Square Root Number Chart? Download this Square Root Number Chart template now!

file format: .pdfView template
Vorschaubild der VorlageSquare Root Table Chart

Square Root Table Chart

How to create a Square Root Table Chart? Download our Square Root Curve Chart template now and streamline your data visualization process!

file format: .pdfView template
Vorschaubild der VorlagePrintable Square Root Chart

Printable Square Root Chart

How to create a Square Root Chart? Download this Printable Square Root Chart template now!

file format: .pdfView template
Vorschaubild der VorlagePerfect Square Root Chart

Perfect Square Root Chart

How to create the Perfect Square Root Chart? Download this Perfect Square Root Chart template now!

file format: .pdfView template
Vorschaubild der VorlageSquare Root Table

Square Root Table

How to make a Square Root Table in Excel? An easy way is to download this example Square Root Table Excel spreadsheet template now!

file format: .xlsView template
Vorschaubild der VorlageSquare Root Chart

Square Root Chart

How to use a Square Root Chart? An easy way to start learning the square roots, is to download this square root template now!
file format: .xlsxView template

Related templates


Author profile

Flenn Garza Flenn Garza