Pyramid Template
Guardar, completar los espacios en blanco, imprimir, listo!
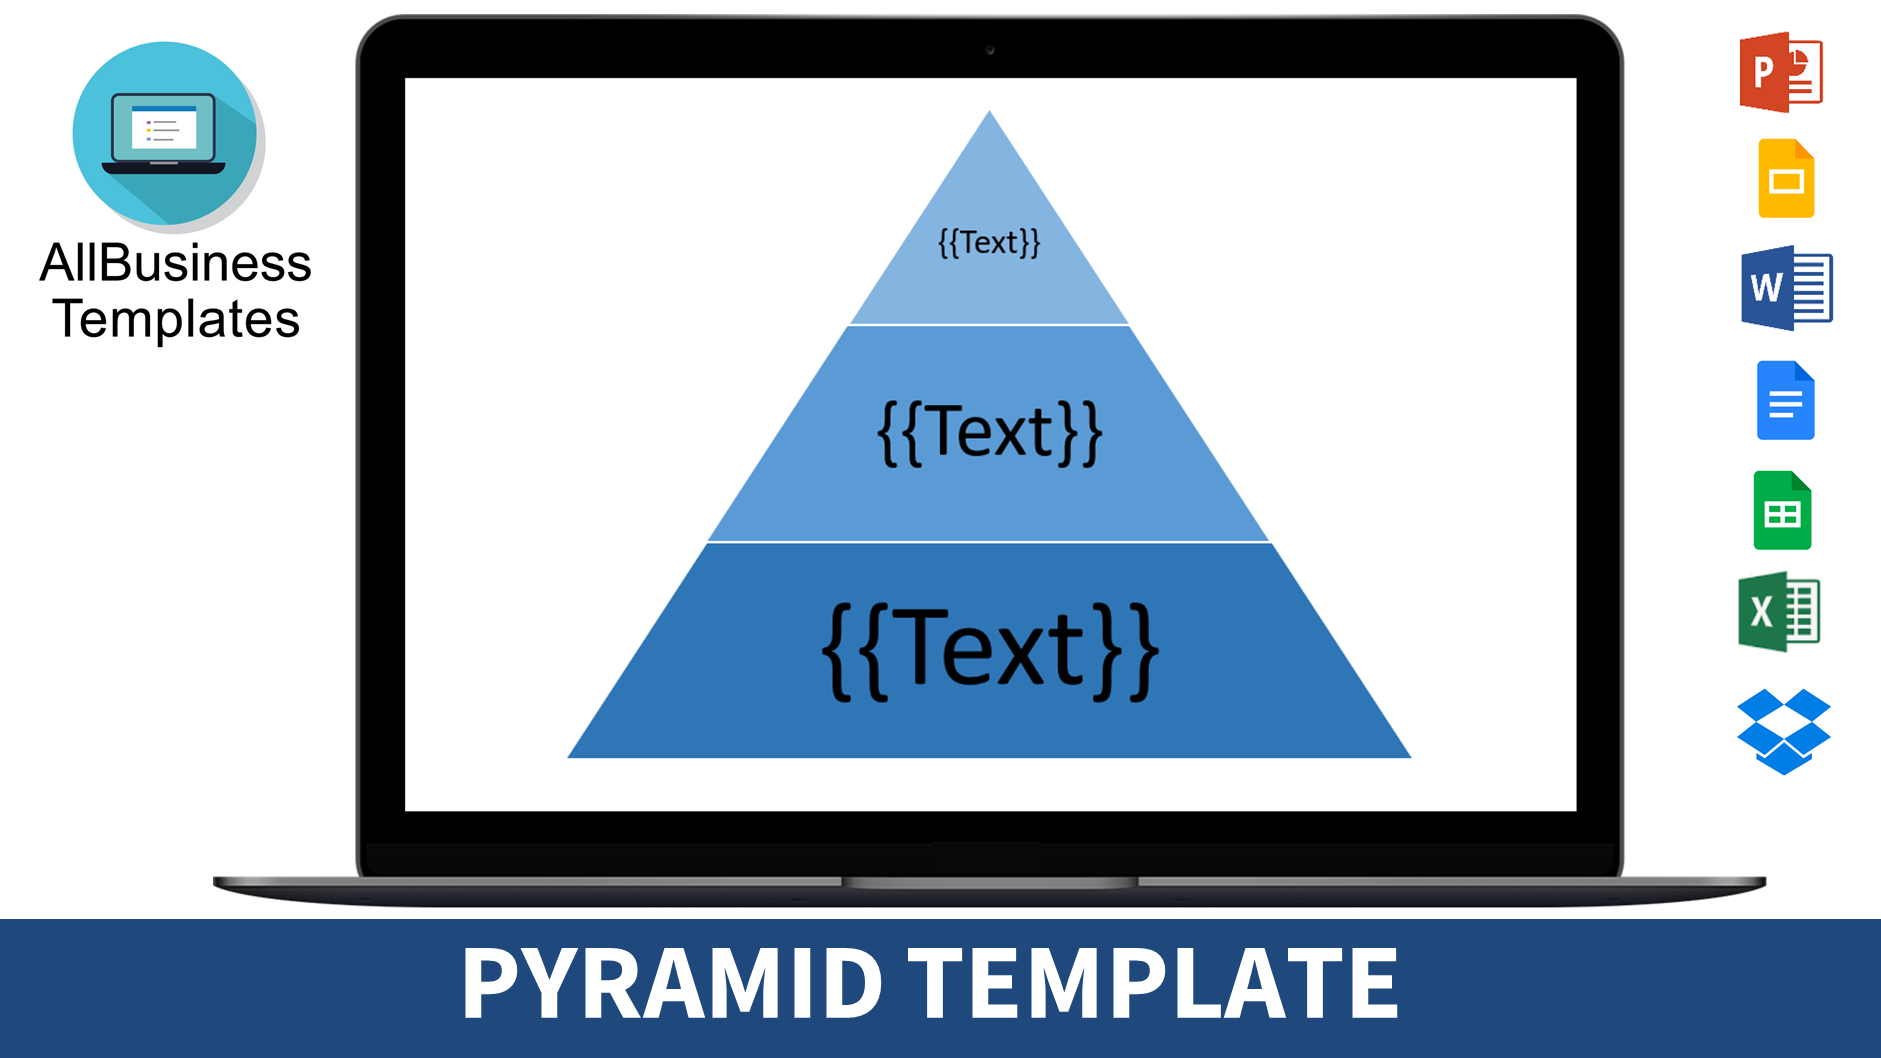
How do you make a pyramid diagram? How do you make a pyramid diagram? Easy to download and use pyramid template
Formatos de archivo disponibles:
.docx- Este documento ha sido certificado por un profesionall
- 100% personalizable

Life Privado Education Educación Marketing Márketing lif vida infographic infografía Process Proceso Design Diseño Leisure Ocio graphics info information graphic infographic powerpoint infographic poster infographic website infographic video infographic canvas infographic template word infographic timeline línea de tiempo infográfica best infographics infographic vector free infographic templates powerpoint how to make an infographic in powerpoint infographic template types of infographic how to make infographic word how to make infographic
How do you make a pyramid diagram? How do I make a professional pyramid? Are you looking for a useful Pyramid Template? Check out this easy-to-use infographic now!
As you assumed correctly, the word infographic comes from Information and Graphics. An Infographic is an overview or collection of imagery, charts, and minimal content that gives an immediate and easy-to-understand overview of a specific topic. It is effective because visual content works. In fact, the brain processes visual content a lot faster than it does text. Infographics are therefore a great way to explain complex information in a simple and concise way.
This Pyramid Template is a good example and easily can be used to make your own personalized Infographic. Infographics often consist of the following three parts: visual, content, and knowledge. The visual part consists of colors and graphics and uses striking, engaging visuals to communicate information quickly and clearly. There are two different types of graphics – theme, and reference. These graphics are included in all infographics and represent the underlying visual representation of the data.
How do you design an infographic?
- Plan your topic and infographic design
- Choose an infographic template to suit your specific needs
- Write an attractive and compelling title
- Create a grid or wireframe for your infographic design
- Use the right infographic layout for your data
- Follow data visualization best practices
- Incorporate different infographic design elements
- Use photography in your infographic design
How to Create an Infographic and Other Visual Projects in 5 Minutes in PowerPoint or Word:
- Check out the basic Infographic templates
- Configure your PPTX or DOCX canvas
- Edit your information
- Add graphics via drag and drop from the template or other sources
- Insert data visualization—charts, maps or videos
- Save and export as PDF and share with your audience
Check out our Infographic Templates and find many suitable Infographic Templates and Designs or download this example file now!
Download this Pyramid template now.
DESCARGO DE RESPONSABILIDAD
Nada en este sitio se considerará asesoramiento legal y no se establece una relación abogado-cliente.
Deja una respuesta. Si tiene preguntas o comentarios, puede colocarlos a continuación.


