Monthly Gantt Chart Excel
Guardar, completar los espacios en blanco, imprimir, listo!
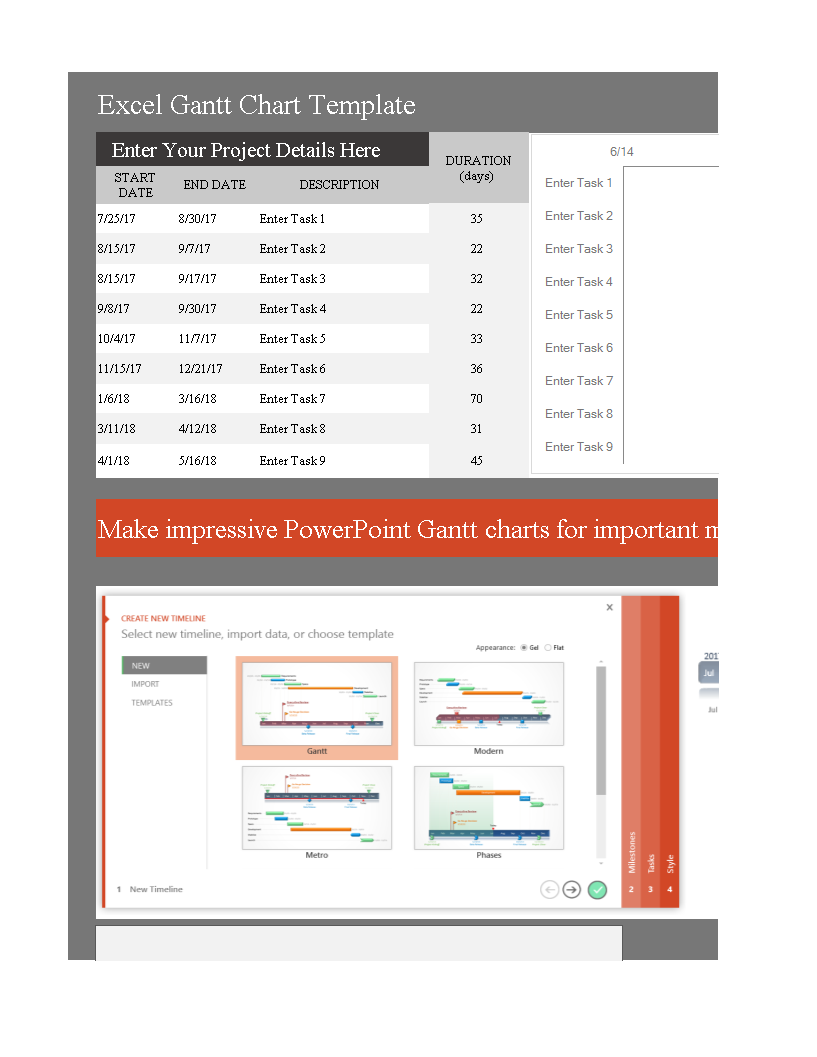
How do I make an Excel Gantt chart that looks professional? What is the process for changing a Gantt chart in Excel from weeks to months? Our monthly Gantt Chart template is in Excel format and is easy to use.
Formatos de archivo disponibles:
.xlsx- Este documento ha sido certificado por un profesionall
- 100% personalizable

Business Negocio gantt chart Gráfico de gantt Projectmanagement Gestión de proyectos gantt Gantt Excel Gantt chart Excel Diagrama de Gantt Excel Chart Gráfico Task Tarea
How do I make an Excel Gantt chart that looks professional? What is the process for changing a Gantt chart in Excel from weeks to months? Our monthly Gantt Chart template is in Excel format and is easy to use. It is fully editable and you can easily customize it to fit your needs. Download this project management Monthly Gantt Chart Excel template now!
A Monthly Gantt Chart in Excel is a visual representation of a project schedule that uses months as the time units on the timeline. It is a variation of the traditional Gantt Chart, which typically uses days or weeks on the horizontal axis to represent the project timeline. A Monthly Gantt Chart provides a broader overview of the project schedule, making it useful for projects with longer durations or when tracking progress over larger time intervals.
Here's a general guide on how to create a Monthly Gantt Chart in Excel:
- List Your Tasks:
- Create a table in Excel with columns for Task Name, Start Date, End Date, and Duration.
- List all the tasks involved in your project.
- Create a Stacked Bar Chart:
- Select the data you've entered.
- Go to the "Insert" tab and choose "Bar Chart." Select "Stacked Bar."
- Format the Bar Chart:
- Format the chart by adjusting the colors, labels, and other elements to make it visually appealing and informative.
- Adjust Dates:
- Since you're creating a Monthly Gantt Chart, the horizontal axis should represent months. Adjust the dates accordingly.
- Set Up Date Formatting:
- Ensure that the dates are formatted appropriately on the horizontal axis. You may need to adjust the date formatting options to display months.
- Add Task Dependencies:
- If there are dependencies between tasks, you can represent them using arrows or lines on the chart. Use Excel's drawing tools for this purpose.
- Add Milestones (Optional):
- If your project has significant milestones, you can add them to the Gantt Chart. These are usually represented by diamonds or other symbols.
- Update and Modify:
- Excel allows you to easily update and modify your Gantt Chart. You can adjust dates, add or remove tasks, and make other modifications as needed.
Creating a Monthly Gantt Chart in Excel follows a similar process to creating a regular Gantt Chart, with the main difference being the time scale used on the horizontal axis. As always, Excel provides flexibility, and you can customize the chart to suit the specific needs of your project.
Using this project management template guarantees that you will save time, cost, and effort and makes you more successful in your project, work, and business!
Completing your project management Monthly Gantt Chart Excel was never simpler! Download it now!
DESCARGO DE RESPONSABILIDAD
Nada en este sitio se considerará asesoramiento legal y no se establece una relación abogado-cliente.
Deja una respuesta. Si tiene preguntas o comentarios, puede colocarlos a continuación.


