Organizational Chart in MS Excel
Guardar, completar los espacios en blanco, imprimir, listo!
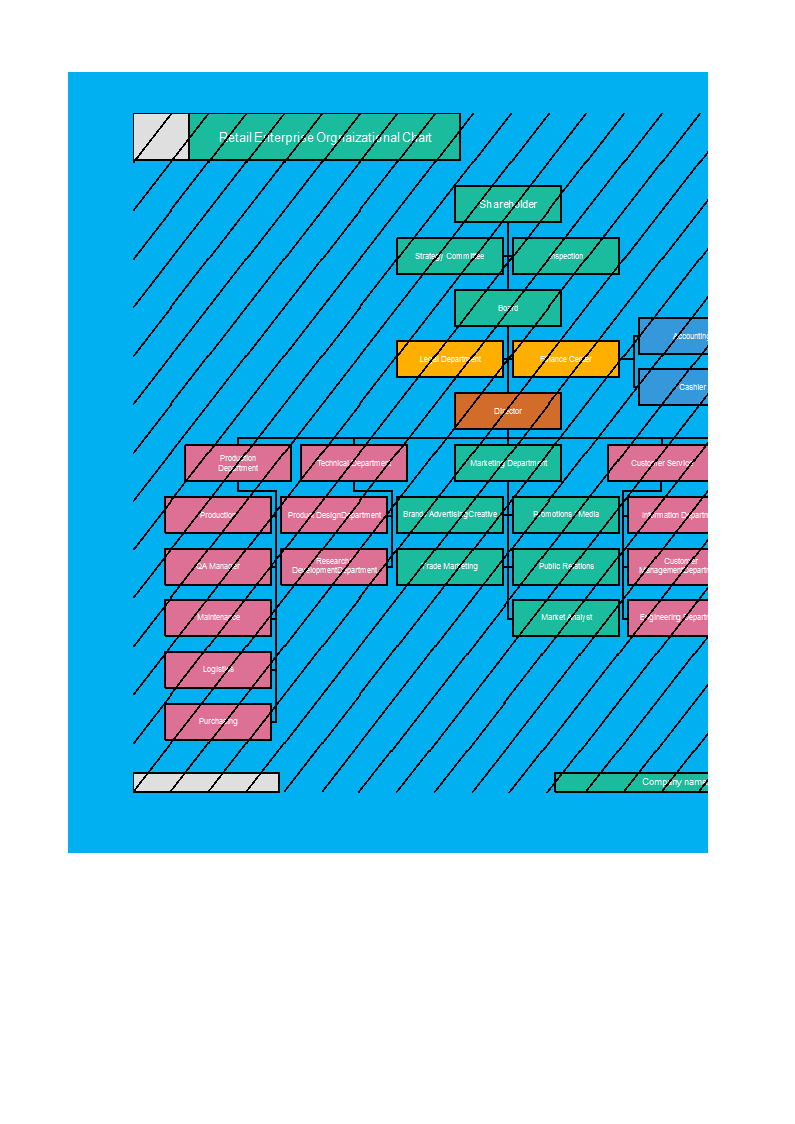
How to make an Organizational Chart in MS Excel? An easy way to create your personalized spreadsheet is by downloading this Excel worksheet now!
Formatos de archivo disponibles:
.xlsx- Este documento ha sido certificado por un profesionall
- 100% personalizable

Business Negocio Excel Chart Gráfico Spreadsheet Hoja de cálculo Organizational Organizativo Excel spreadsheet hoja de cálculo de Excel Excel template Excel modelo Excel templates for business best excel templates mejores plantillas de excel project management excel templates gestión de proyectos Excel plantillas xls xlsx template Excel spreadsheet plantilla de hoja de calculo Excel organizational chart in excel spreadsheet organizational chart in excel sample organizational chart in excel template
Are you looking for a Organizational Chart in excel? Check out this easy-to-use Organizational Chart in MS Excel now!
How do I make an infographic?
As you assumed right, the word infographic comes from Information and Graphics. An Infographic is an overview or collection of imagery, charts, and minimal content that gives an immediate and easy-to-understand overview of a specific topic. They are effective because visual content works. In fact, the brain processes visual content a lot faster than it does text. Infographics are therefore a great way to explain complex information in a simple and concise way.
This Organizational Chart in excel is a good example and can be easily used to make your own personalized Infographic. Infographics often consist of the following three parts: visual, content, and knowledge. The visual part consists of colors and graphics and is use striking, engaging visuals to communicate information quickly and clearly. There are two different types of graphics – theme, and reference. Theme graphics are included in all infographics and represent the underlying visual representation of the data.
How do you design an infographic?
- Plan your topic and infographic design
- Choose an infographic template to suit your specific needs
- Write an attractive and compelling title
- Create a grid or wireframe for your infographic design
- Use the right infographic layout for your data
- Follow data visualization best practices
- Incorporate different infographic design elements
- Use photography in your infographic design
How to Create an Infographic and Other Visual Projects in 5 Minutes in PowerPoint or Word?
- Check out the basic Infographic templates
- Configure your PPTX or DOCX canvas
- Edit your information
- Add graphics via drag and drop from the template or other sources
- Insert data visualization—charts, maps or videos
- Save and export as PDF and share with your audience
Check out our Infographic Templates and find many suitable Infographic Templates and Designs, or download this Infographic template now!
DESCARGO DE RESPONSABILIDAD
Nada en este sitio se considerará asesoramiento legal y no se establece una relación abogado-cliente.
Deja una respuesta. Si tiene preguntas o comentarios, puede colocarlos a continuación.


