Fishbone template
Guardar, completar los espacios en blanco, imprimir, listo!
How to make an effective Fishbone Diagram or Ishikawa Diagram? Download this project management Fishbone Diagram template now!
Formatos de archivo disponibles:
.pptxOtros idiomas disponibles::
- Este documento ha sido certificado por un profesionall
- 100% personalizable

Business Negocio Finance Financiar HR RH fishbone diagram diagrama de espina de pescado fishbone espina timeline línea de tiempo PowerPoint Design Diseño Root Cause Analysis Análisis de la causa raíz diagram fishbone diagrama espina de pescado ishikawa fishbone ishikawa espina de pescado design fishbone espina de pescado de diseño fishbone design diagram diagrama de diseño de espina de pescado how to make a fishbone como hacer una espina de pez herringbone diagram diagrama de espina de pescado ppt pptx simple powerpoint templates powerpoint template best PPT templates free download Descarga gratuita de las mejores plantillas PPT professional PowerPoint templates free download Descarga gratuita de plantillas profesionales de PowerPoint. ishikawa diagram template ishikawa excel diagram ishikawa excel diagram template use of ishikawa diagram ishikawa diagram is also known as fishbone analysis cause and effect diagram example cause effect diagram example cause effect diagram fishbone diagram pdf fishbone diagram template excel plantilla de diagrama de espina de pescado Excel fishbone diagram cause and effect cause and effect analysis analysis template analysis method excel template analysis excel template analysis method excel herringbone fishbone analysis ishikawa fishbone analysis kaoru ishikawa timeline diagram diagrama de línea de tiempo timeline example ejemplo de línea de tiempo
How to make an effective Fishbone Diagram or Ishikawa Diagram? Download this project management Fishbone Diagram template now!
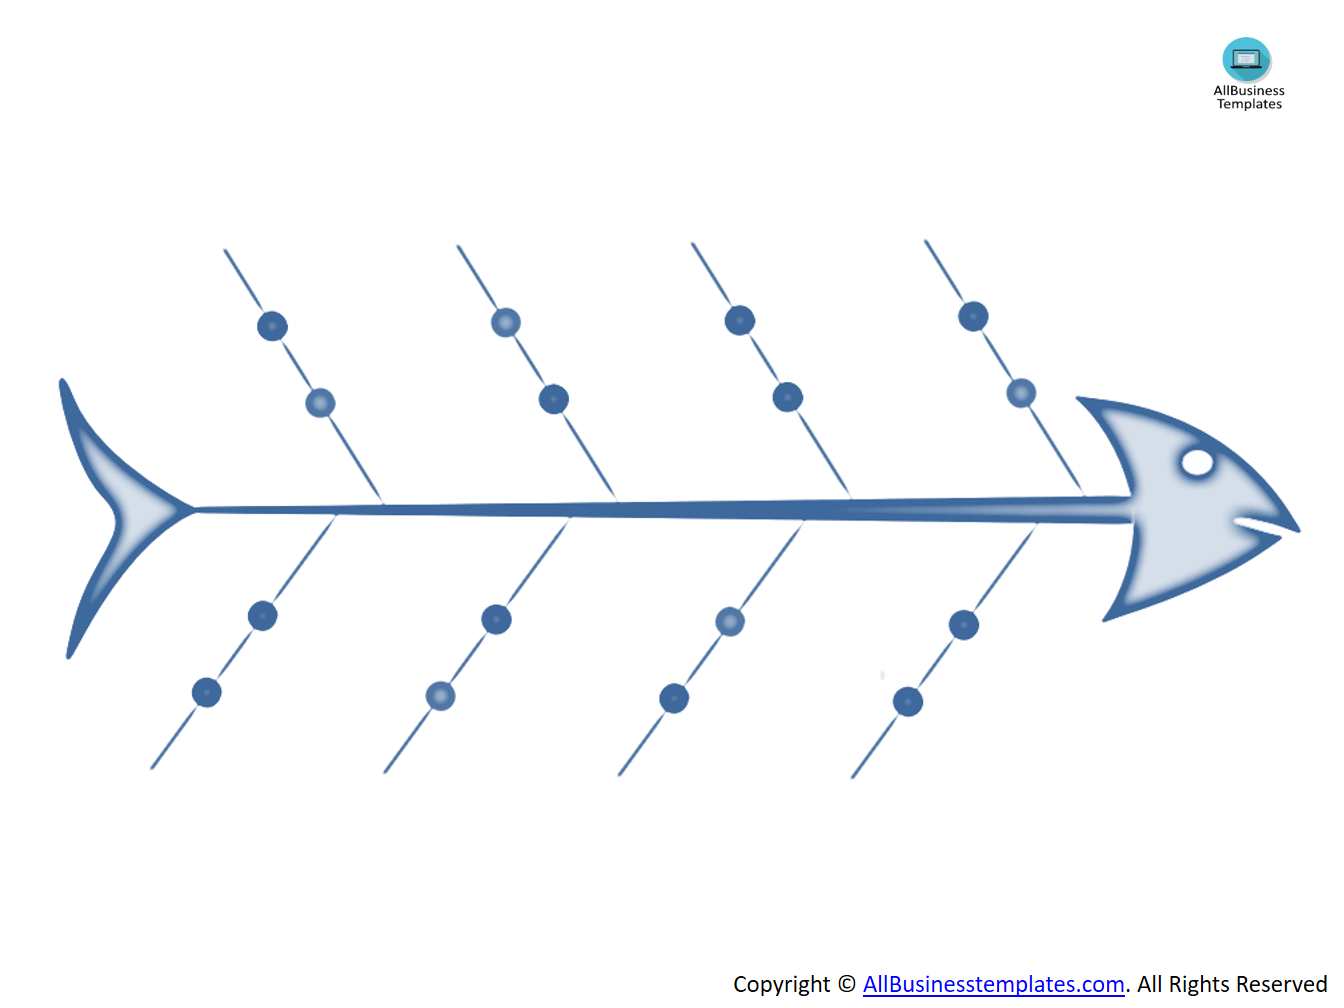
An Ishikawa diagram (also known as Fishbone diagram, herringbone diagram, Cause-Effect diagram) is an overview that visualizes the causes of an effect or event and is often used in manufacturing and product development. The name Fishbone diagram was given due to its shape that with little imagination looks like the section view of a fish skeleton. This allows the designers or managers to outline the different activities taken in a process, and visualizes where Quality Control (QC) issues might arise, and determines what kind of resources are required at specific moments during the development.
Ishikawa diagrams became popular in the 1960’s by Kaoru Ishikawa. He is considered to be the pioneer of Quality Management processes in the Kawasaki shipyards, and became one of the founding fathers of modern management as we know it today. However, the basic concept of cause-and-effect analysis was first used in the 1920s’, considered one of the seven basic instruments to perform Quality Control.
Advantages of working with Fishbone diagram:
- Quickly identifies root-cause multiple times in the same or different causal tree
- Highly visual brainstorming instrument, leads to synergy of the brainstorm group that can detect further examples of root causes
- Allows to see in 1 overview all relevant causes simultaneously
- Perfect visualization tool to present summaries for top management and stakeholders for presenting issues
Disadvantages
- Interrelationships or correlations between causes are not easily identifiable
- No weight can be allocated to complex defects that might yield a lot of causes which might become visually cluttering
The Ishikawa diagram is created by Kaoru Ishikawa, and this diagram is also known as:
- Fishbone diagram;
- Herringbone diagram;
- Cause-and-effect diagram;
- Fishikawa diagram;
- Root-cause analysis;
- Cause-effect analysis;
The Ishikawa Diagram is commonly used for product design purposes or quality defect prevention to identify potential factors causing an overall effect. Each cause or reason for imperfection is a source of variation. Causes are usually grouped into major categories to identify and classify these sources of variation. It will help you achieve your goals by visualizing the important target and the supportive goals. The issue or defect is shown as the fish's head, facing to the east, with the causes extending to the left as fish bones; the ribs branch off the backbone for major causes, with sub-branches for root-causes, to as many levels as required.
This Powerpoint Fishbone diagram can be used product design purposes or quality defect prevention to identify potential factors causing an overall effect. Each cause or reason for imperfection is a source of variation. Causes are usually grouped into major categories to identify and classify these sources of variation.
In order to rapidly manifest your needs, you need to get clear on paper exactly what it is that you want, this Diagram Fishbone presentation can give you the desired overview. It will help you achieve your goals by visualizing the important target and the supportive goals.
Download this Ishikawa Diagram template now and start creating your own cause-effect analysis.
DESCARGO DE RESPONSABILIDAD
Nada en este sitio se considerará asesoramiento legal y no se establece una relación abogado-cliente.
Deja una respuesta. Si tiene preguntas o comentarios, puede colocarlos a continuación.


