Fishbone template
Save, fill-In The Blanks, Print, Done!

Download Fishbone template
(.pptx)Other languages available:
- This Document Has Been Certified by a Professional
- 100% customizable
- This is a digital download (172.78 kB)
- Language: English
- We recommend downloading this file onto your computer.

How to make an effective Fishbone Diagram or Ishikawa Diagram? Download this project management Fishbone Diagram template now!
An Ishikawa diagram (also known as Fishbone diagram, herringbone diagram, Cause-Effect diagram) is an overview that visualizes the causes of an effect or event and is often used in manufacturing and product development. The name Fishbone diagram was given due to its shape that with little imagination looks like the section view of a fish skeleton. This allows the designers or managers to outline the different activities taken in a process, and visualizes where Quality Control (QC) issues might arise, and determines what kind of resources are required at specific moments during the development.
Ishikawa diagrams became popular in the 1960’s by Kaoru Ishikawa. He is considered to be the pioneer of Quality Management processes in the Kawasaki shipyards, and became one of the founding fathers of modern management as we know it today. However, the basic concept of cause-and-effect analysis was first used in the 1920s’, considered one of the seven basic instruments to perform Quality Control.
Advantages of working with Fishbone diagram:
- Quickly identifies root-cause multiple times in the same or different causal tree
- Highly visual brainstorming instrument, leads to synergy of the brainstorm group that can detect further examples of root causes
- Allows to see in 1 overview all relevant causes simultaneously
- Perfect visualization tool to present summaries for top management and stakeholders for presenting issues
Disadvantages
- Interrelationships or correlations between causes are not easily identifiable
- No weight can be allocated to complex defects that might yield a lot of causes which might become visually cluttering
The Ishikawa diagram is created by Kaoru Ishikawa, and this diagram is also known as:
- Fishbone diagram;
- Herringbone diagram;
- Cause-and-effect diagram;
- Fishikawa diagram;
- Root-cause analysis;
- Cause-effect analysis;
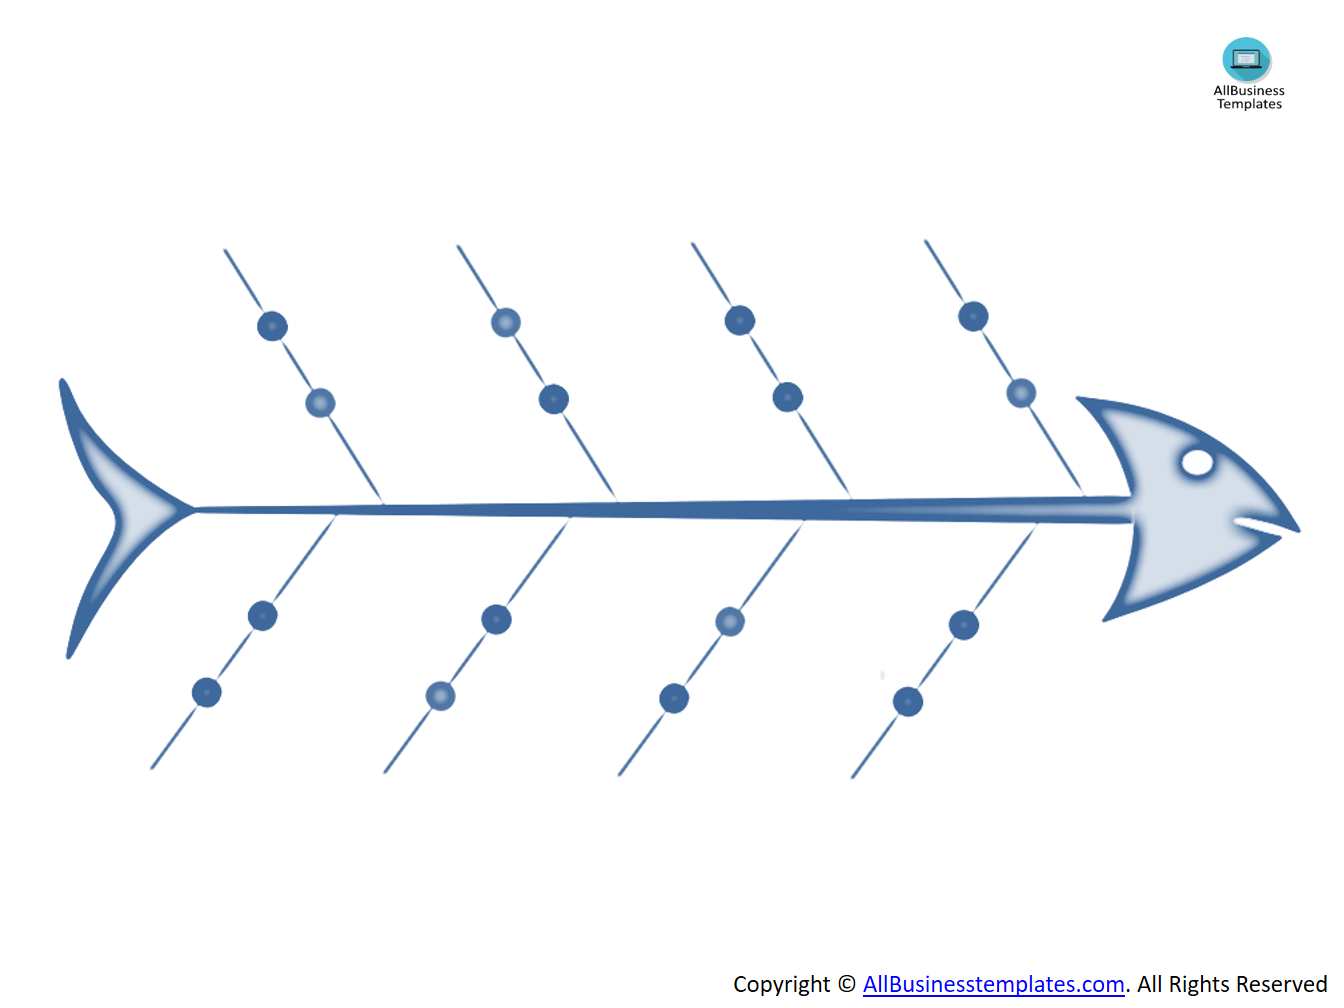
The Ishikawa Diagram is commonly used for product design purposes or quality defect prevention to identify potential factors causing an overall effect. Each cause or reason for imperfection is a source of variation. Causes are usually grouped into major categories to identify and classify these sources of variation. It will help you achieve your goals by visualizing the important target and the supportive goals. The issue or defect is shown as the fish's head, facing to the east, with the causes extending to the left as fish bones; the ribs branch off the backbone for major causes, with sub-branches for root-causes, to as many levels as required.
This Powerpoint Fishbone diagram can be used product design purposes or quality defect prevention to identify potential factors causing an overall effect. Each cause or reason for imperfection is a source of variation. Causes are usually grouped into major categories to identify and classify these sources of variation.
In order to rapidly manifest your needs, you need to get clear on paper exactly what it is that you want, this Diagram Fishbone presentation can give you the desired overview. It will help you achieve your goals by visualizing the important target and the supportive goals.
Download this Ishikawa Diagram template now and start creating your own cause-effect analysis.
DISCLAIMER
Nothing on this site shall be considered legal advice and no attorney-client relationship is established.
Leave a Reply. If you have any questions or remarks, feel free to post them below.
Diagram Fishbone
Fishbone diagrams help to group the causes are into major categories to identify and classify these sources of variation. Check out our Fishbone diagrams now.
Read moreRelated templates


Latest templates
Latest topics
- AI Cheat Sheet
How to Prompt Perfectly? Check out this 11 Essential AI Prompting Cheat Sheet, the Ultimate AI Prompt Engineering Guide! - Letter Format
How to proper format a letter? Here is a brief overview of common letter formats and templates in USA and UK and get inspirited immediately! - Excel Templates
Where to find usefl Excel templates? How do I create a template in Excel? Check these editable and printable Excel Templates and download them directly! - GDPR Compliance Templates
What You Need To Be DPR compliant? Are you looking for useful GDPR document templates to make you compliant? All these compliance documents will be available to download instantly... - Authorization Letter To Claim
How to write an authorization letter that gets results? Check out our authorization letter sample and formats for an act on behalf, claiming, collect document, pick up & process documents, etc
cheese