Organizational Chart Maker Excel
Enregistrer, Remplir les champs vides, Imprimer, Terminer!
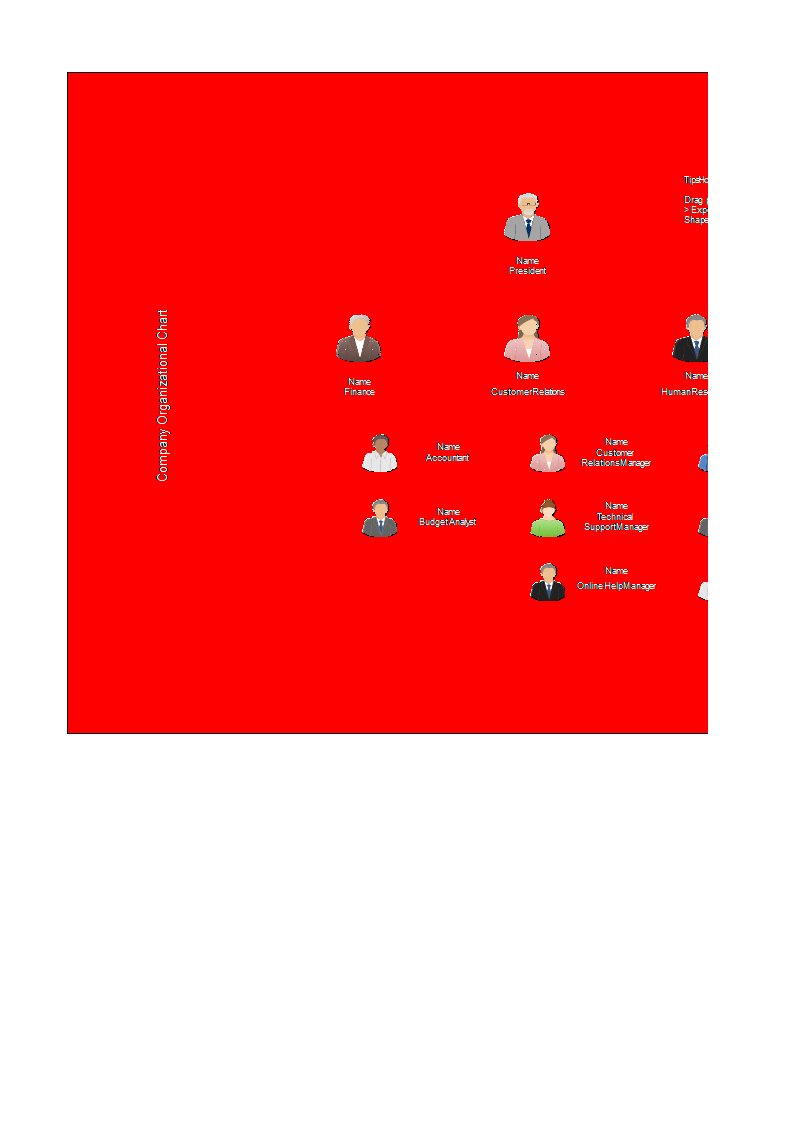
Are you looking for an Organizational Chart Maker in Excel? Check out this easy-to-use Organizational Chart Maker Excel now!
Formats de fichiers gratuits disponibles:
.xlsx- Ce document a été certifié par un professionnel
- 100% personnalisable

Business Entreprise HR RH Marketing Commercialisation Excel infographic infographie Process Processus Design Conception Chart Graphique Spreadsheet Tableur Organizational Organisationnel Hierarchy Chart Tableau de hiérarchie Business Organizational Chart Organigramme de l'entreprise Organizational Chart Organigramme Organizational Chart Example Exemple d'organigramme Excel spreadsheet Feuille de calcul Excel graphics info information graphic infographic powerpoint infographic poster infographic website infographic video infographic canvas infographic template word infographic timeline chronologie infographique best infographics infographic vector free infographic templates powerpoint how to make an infographic in powerpoint infographic template types of infographic how to make infographic word how to make infographic Excel template Excel modèle Excel templates for business best excel templates meilleurs modèles Excel project management excel templates modèles de gestion de projet excel xls xlsx template Excel spreadsheet modèle de feuille de calcul Excel organizational chart in excel spreadsheet organizational chart in excel sample organizational chart in excel template organizational chart maker organizational chart meaning organizational chart definition organizational chart for small business types of organizational chart organizational chart sme organizational chart of a company corporation flowchart organizational chart ppt organogram organigramme organigram organizational structure org chart functional organizational structure type of organizational structure org chart examples org chart excel creating an organizational chart organizational structure of amazon non profit organizational chart creating an org chart division organizational structure organizational structure of hospitals flow chart of management structure organisation chart in excel template organogram template modèle d'organigramme what is an organogram qu'est ce qu'un organigramme organogram maker créateur d'organigramme organogram Word organigramme Word types of organogram organogram or organigram organigramme ou organigramme
Are you looking for an Organizational Chart Maker in Excel? Check out this easy-to-use Organizational Chart Maker Excel now!
How do I make an infographic?
As you assumed right, the word infographic comes from Information and Graphics. An Infographic is an overview or collection of imagery, charts, and minimal content that gives an immediate and easy-to-understand overview of a specific topic. They are effective because visual content works. In fact, the brain processes visual content a lot faster than it does text. Infographics are therefore a great way to explain complex information in a simple and concise way.
This Organizational Chart in excel is a good example and can be easily used to make your own personalized Infographic. Infographics often consist of the following three parts: visual, content, and knowledge. The visual part consists of colors and graphics and is use striking, engaging visuals to communicate information quickly and clearly. There are two different types of graphics – theme, and reference. Theme graphics are included in all infographics and represent the underlying visual representation of the data.
How do you design an infographic?
- Plan your topic and infographic design
- Choose an infographic template to suit your specific needs
- Write an attractive and compelling title
- Create a grid or wireframe for your infographic design
- Use the right infographic layout for your data
- Follow data visualization best practices
- Incorporate different infographic design elements
- Use photography in your infographic design
How to Create an Infographic and Other Visual Projects in 5 Minutes in Excel?
- Check out the basic Infographic templates
- Configure your XLSX canvas
- Edit your information
- Add graphics via drag and drop from the template or other sources
- Insert data visualization—charts, maps or videos
- Save and export as XLSX or PDF and share with your audience
Check out our Infographic Templates and find many suitable Infographic Templates and Designs, or download this Infographic template now!
AVERTISSEMENT
Rien sur ce site ne doit être considéré comme un avis juridique et aucune relation avocat-client n'est établie.
Si vous avez des questions ou des commentaires, n'hésitez pas à les poster ci-dessous.