HTML Preview Natural Gas Storage page number 1.
0
500
1,000
1,500
2,000
2,500
3,000
3,500
4,000
4,500
Jan-16 Apr-16 Jul-16 Oct-16 Jan-17 Apr-17 Jul-17 Oct-17 Jan-18
Billion Cubic Feet (Bcf)
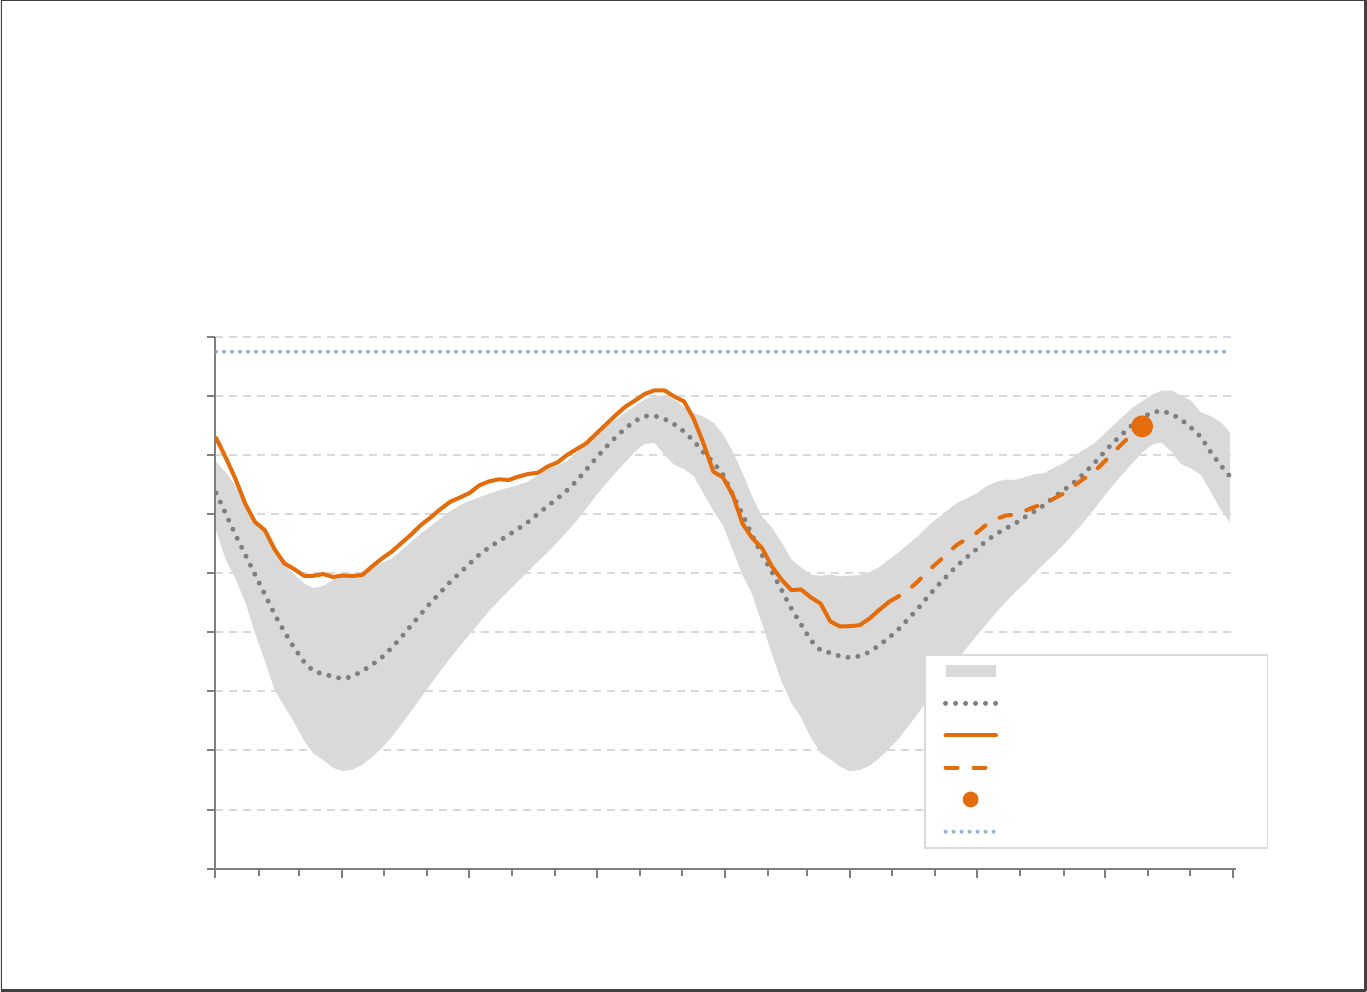
U.S. Natural Gas Storage Inventories
(And Seasonal Storage Projection)
5-Yr Range
5-Yr Avg
2016-17 Actuals
ESI Projection
End of Injection Season
Demonstrated Max Capacity