HTML Preview Daily Temperature Chart page number 1.
0
20
40
60
80
100
1
11
21
31
10
20
2
12
22
1
11
21
1
11
21
31
10
20
30
10
20
30
9
19
29
8
18
28
8
18
28
7
17
27
7
17
27
Degrees
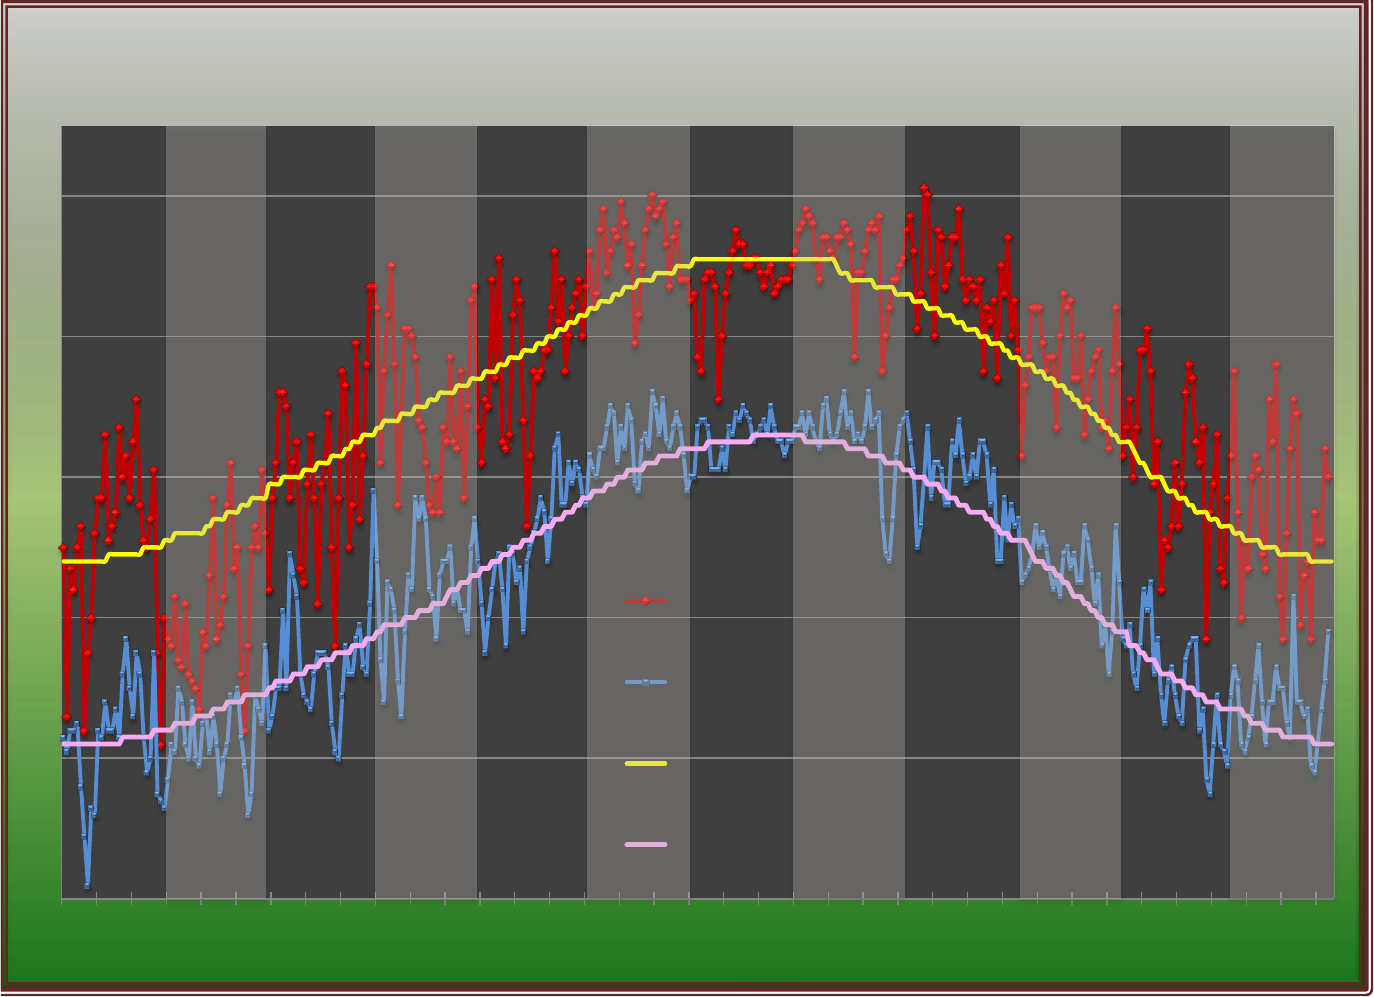
Daily Temperature Chart for 2010
Observed High
Observed Low
Normal High
Normal Low
January
February
March April May June
July
August
September
October
November December