fishbone diagram template sheet in excel
Speichern, ausfüllen, drucken, fertig!
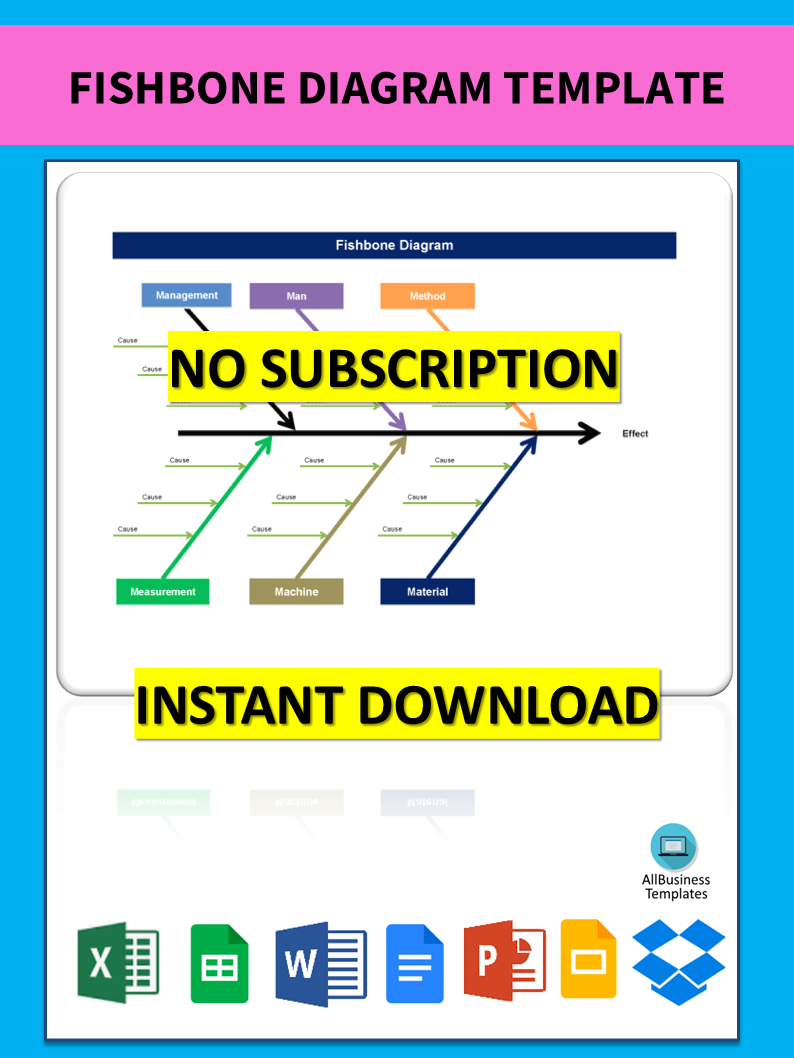
How to make a fishbone diagram in Excel? An easy way to create your personalized Ishikawa diagram spreadsheet is by downloading this cause-effect analysis sheet now!
Verfügbare Gratis-Dateiformate:
.xlsxWeitere verfügbare Sprachen:
- Dieses Dokument wurde von einem Professional zertifiziert
- 100% anpassbar

Business Unternehmen fishbone Gräten project timeline Projekt Zeitleiste timeline Zeitleiste Excel Spreadsheet Kalkulationstabelle Diagram Diagramm Root Cause Analysis Ursachenanalyse herringbone diagram Fischgrät Diagramm Project Management Timeline Projektmanagement Zeitleiste Excel spreadsheet Excel Arbeitsmappe Excel template Excel vorlage Excel templates for business Excel-Vorlagen für Unternehmen best excel templates beste Excel Vorlagen project management excel templates Projektmanagement Excel Vorlagen xls xlsx Fishbone Diagram Template Fishbone-Diagrammvorlage template Excel spreadsheet Vorlage Excel-Tabelle fishbone diagram template sheet in excel sample fishbone diagram template sheet in excel template ishikawa diagram template ishikawa excel diagram ishikawa excel diagram template use of ishikawa diagram ishikawa diagram is also known as fishbone analysis cause and effect diagram example cause effect diagram example cause effect diagram fishbone diagram pdf fishbone diagram template excel Excel-Vorlage für Fischgrätendiagramme fishbone diagram cause and effect cause and effect analysis analysis template analysis method excel template analysis excel template analysis method excel herringbone fishbone analysis ishikawa fishbone analysis kaoru ishikawa timeline diagram Zeitdiagramm timeline example Zeitleiste Beispiel timeline template ppt Zeitleistenvorlage ppt timeline template free timeline template google docs Zeitachsenvorlage Google Docs timeline template free download Timeline-Vorlage kostenlos herunterladen timeline template word free download Timeline-Vorlage Word Kostenloser Download timeline template google slides Timeline-Vorlage Google Slides timeline template canva timeline template ppt free timeline template blank Zeitachsenvorlage leer powerpoint timeline template PowerPoint zeitleiste vorlage project timeline template excel Excel-Vorlage für den Projektzeitplan wedding timeline template Vorlage für die Hochzeitszeitleiste free timeline template Kostenlose Timeline-Vorlage powerpoint timeline template free wedding day timeline template history timeline template blank timeline template leere zeitleistenvorlage timeline powerpoint template free Timeline powerpoint vorlage kostenlos
- Quickly identifies root-cause multiple times in the same or different causal tree
- Highly visual brainstorming instrument, leads to synergy of the brainstorm group that can detect further examples of root causes
- Allows to see in 1 overview all relevant causes simultaneously
- Perfect visualization tool to present summaries for top management and stakeholders for presenting issues
- Interrelationships or correlations between causes are not easily identifiable
- No weight can be allocated to complex defects that might yield a lot of causes which might become visually cluttering
- Fishbone diagram;
- Herringbone diagram;
- Cause-and-effect diagram;
- Fishikawa diagram;
- Root-cause analysis;
- Cause-effect analysis.
This Excel spreadsheet is an interactive digital worksheet in tabular form and designed to organize information and perform calculations with scalable entries. It's not a matter of being a beginner or professional, from all over the world, are now using spreadsheets to create tables, calculations, comparisons, overviews, etc for any personal or business need. This useful worksheet in Excel will make the task a little easier and can be used for organization, analysis, accounting and storage of data in order to increase your productivity. This fishbone diagram template sheet in excel gives you a head start and is useful because it also has the basic formula’s included. If time and quality are of the essence, this worksheet can certainly help you out!
HAFTUNGSAUSSCHLUSS
Nichts auf dieser Website gilt als Rechtsberatung und kein Mandatsverhältnis wird hergestellt.
Wenn Sie Fragen oder Anmerkungen haben, können Sie sie gerne unten veröffentlichen.