HTML Preview Simple Control page number 1.
(R 2-12) WHA Quality Data
Analysis of the Control Chart
Once a control chart is made, it is even more important to understand how to interpret them and realize
when there is a problem. All processes have some kind of variation and this process variation can be
partitioned into two main components. First there is natural process variation, frequently called
"common cause" or system variation. These are common variations caused by machines, material and
the natural flow of the process.
Second is special cause variation, generally caused by some problem or extraordinary occurrence in the
system. It is our job to work at trying to eliminate or minimize both of these types of variation. Below is
an example of a few different process variations and how to recognize a potential problem.
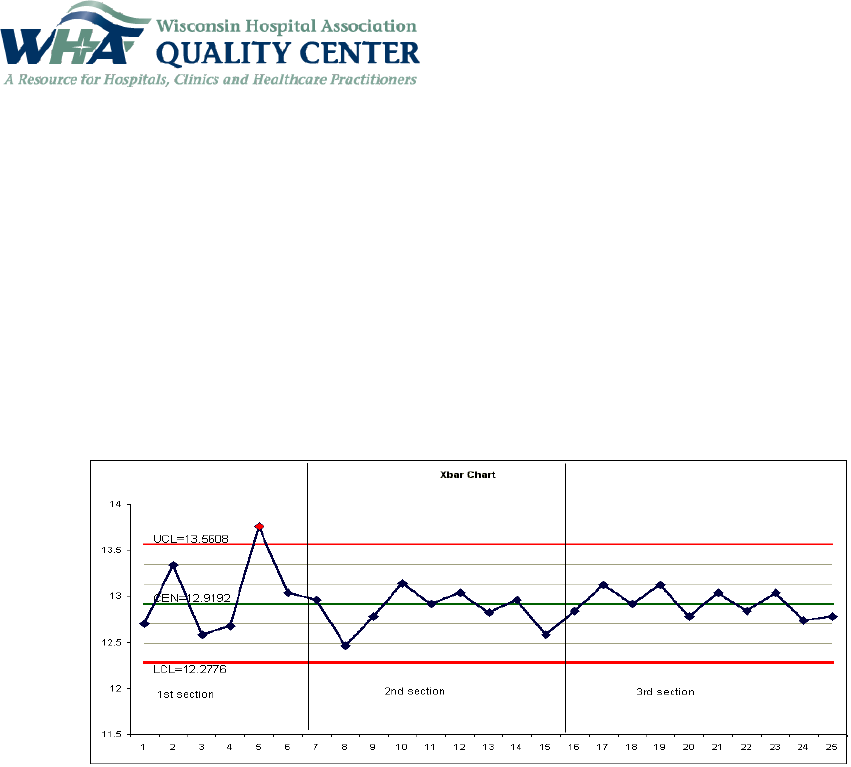
There are three divided sections in the above chart. The first section is termed "out of statistical
control" for several reasons. Notice the inconsistent plot points and that one point is outside of the
control limits. This means that a source of special cause variation is present; it needs to be analyzed and
resolved. Having a point outside the control limits is usually the most easily detectable condition. There
is almost always an associated cause that can be easily traced to some malfunction in the process.
In the second section, even though the process is now in control, it is not really a smooth flowing
process. All the points lie within the control limits and thus exhibit only common cause variations.
In the third section you will notice that the trending is more predictable and smoother flowing. It is in
this section that there is evidence of process improvement and the variation has been reduced.
Therefore, to summarize, eliminating special cause variation keeps the process in control; process
improvement reduces the process variation, and moves the control limits in toward the centerline of the
process. There are a few more terms listed below that you need to become familiar with when analyzing
an Xbar Chart and the process:
RUN - When several plotted points line up consecutively on one side of a Central Line (CL),
whether it is located above or below the CL it is called a "run". If there are 7 points in a row on
one side of the CL, there is an abnormality in the process and it requires an adjustment.