HTML Preview Infant Girl Growth Chart page number 1.
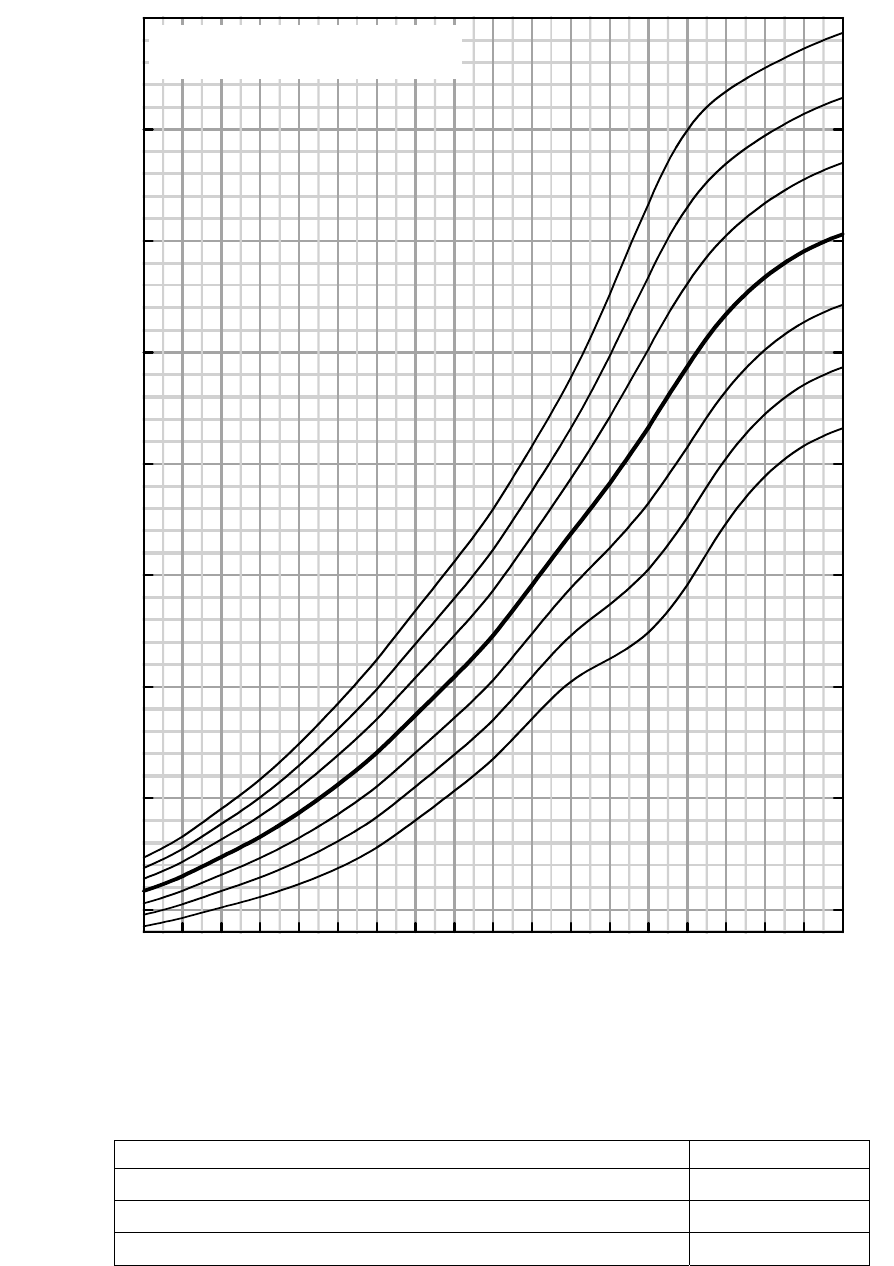
Intrauterine Growth Curves Name _______________________________________
* 3
rd
and 97
th
percentiles on all curves for 23 weeks should be interpreted cautiously given the small sample size.
Record # _____________________________________
FEMALES
500
1000
1500
2000
2500
3000
3500
4000
4500
23 25 27 29 31 33 35 37 39 41
Weight, gm
Gestational Age, weeks
90th
97th
75th
50th
25th
10th
3rd
Birth Weight _______g
Reproduced with permission from: Olsen IE, Groveman S, Lawson ML, Clark R, Zemel B. New intrauterine growth curves based on U.S. data.
Pediatrics, Volume 125, Pages e214-e244. Copyright 2010 by the American Academy of Pediatrics. Data source: Pediatrix Medical Group
BIRTH SIZE ASSESSMENT
Date of birth: / / ( wks GA)
Select one
Large-for-gestational age (LGA) >90
th
percentile
Appropriate-for-gestational age (AGA) 10-90
th
percentile
Small-for-gestational age (SGA) <10
th
percentile
*
Grams