HTML Preview Chart Excel page number 1.
Run Chart Template
Developed by Richard Scoville, PhD. (richard@rscoville.net)
Graph Label
Y Axis Label
X Axis Label
Date /
Observation
Value Median Goal
End
Median
1 10 10 11
2 12 10 11
3 8 10 11
4 13 10 11
5 9 10 11 X
10 11
10 11
10 11
10 11
10 11
10 11
10 11
10 11
10 11
10 11
10 11
10 11
10 11
10 11
10 11
10 11
10 11
10 11
10 11
10 11
10 11
10 11
10 11
10 11
10 11
10 11
10 11
10 11
10 11
10 11
10 11
10 11
10 11
10 11
10 11
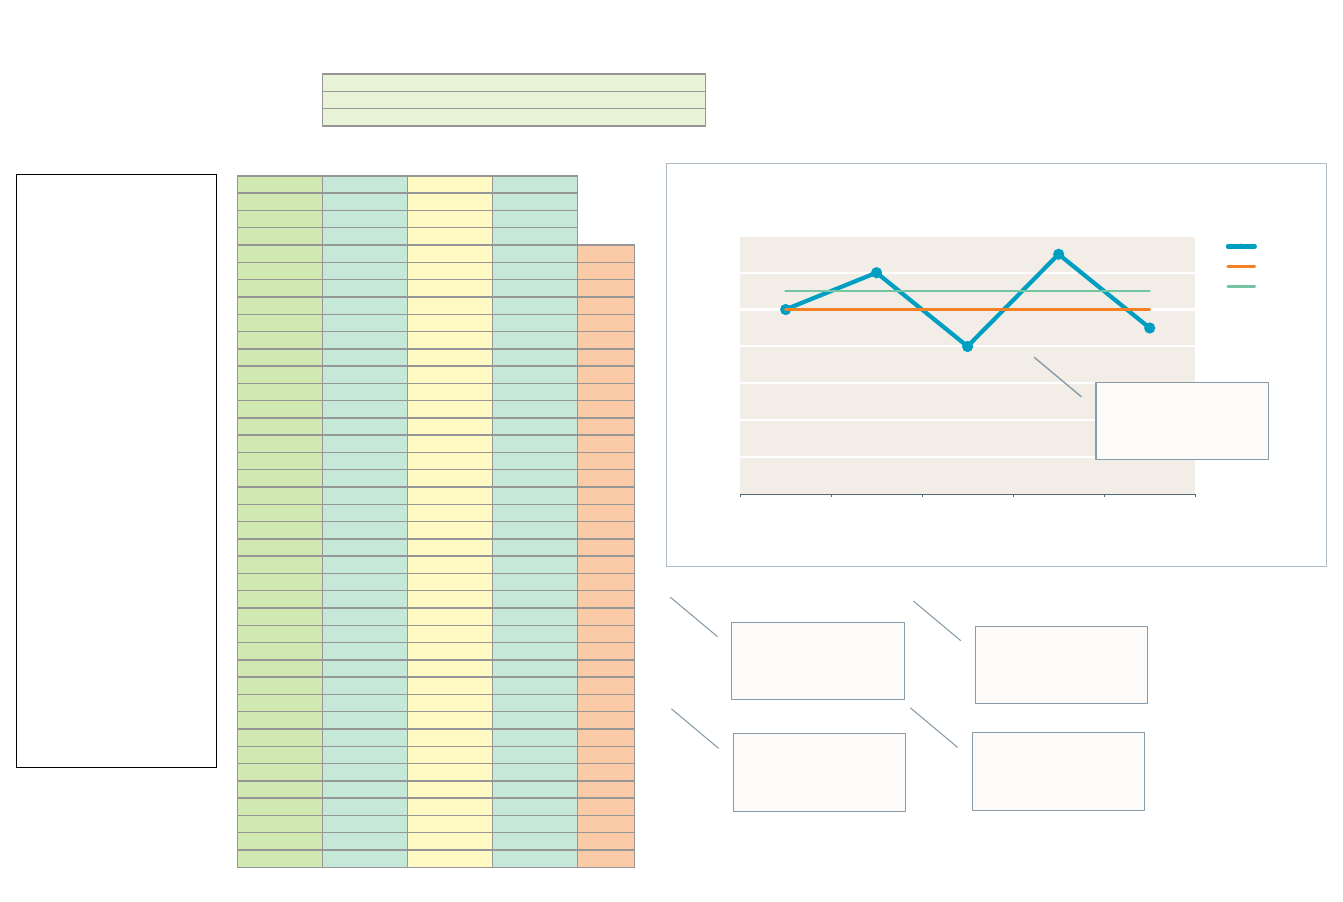
Graph Title
Y Axis Label
X Axis Label
Enter dates or observation
numbers into the green cells at
right. (clear the sample data
before you begin)
Enter your data values into the
blue cells. Goal values are
optional.
Don't leave any blank cells in
the Date/Observation
column.
Enter an 'X' into the End
Median column to mark the last
row to be included in the
median
Enter your graph title, x axis,
and y axis label into the cells
provided.
Use the boxes below the graph
to annotate where interventions
were introduced. Drag the box
to the data point on the graph.
(Note: This may require some
formatting adjustments.)
Use regular Excel commands
to configure the graph.
See sheet 'Rules for
Interpreting Charts' for
information about interpreting
charts
0
2
4
6
8
10
12
14
1 2 3 4 5
Graph Title
Values
Median
Goal
X Axis Label
Y Axis Label
Add intervention details here
and drag to corresponding
data point on graph.
Add intervention details here
and drag to corresponding
data point on graph.
Add intervention details here
and drag to corresponding
data point on graph.
Add intervention details here
and drag to corresponding
data point on graph.
Add intervention details here
and drag to corresponding
data point on graph.
Run Chart Template.xls!Run Chart
9/1/2016 2:04 PM • Page 1 of 1