HTML Preview Retail Sales Report page number 1.
BNZ Online Retail Sales Report
Monthly Update: March 2015 online retail sales
Focus topic: Trends in Kiwis’ purchases at international sites
Bank of New Zealand P a g e | 1
Annual growth in online spending nudges back into double digits
Total online retail spending was up 11% compared to March 2014 levels.
Online purchases at domestic merchants in March were up 7% on the spending levels a year earlier, which is
slightly ahead of the growth in spending at physical stores (approx. 5%, based on electronic card transactions)
^
.
Spending at international sites was very strong in March - up 18% on the level we saw in March last year.
Growth rates by category groups
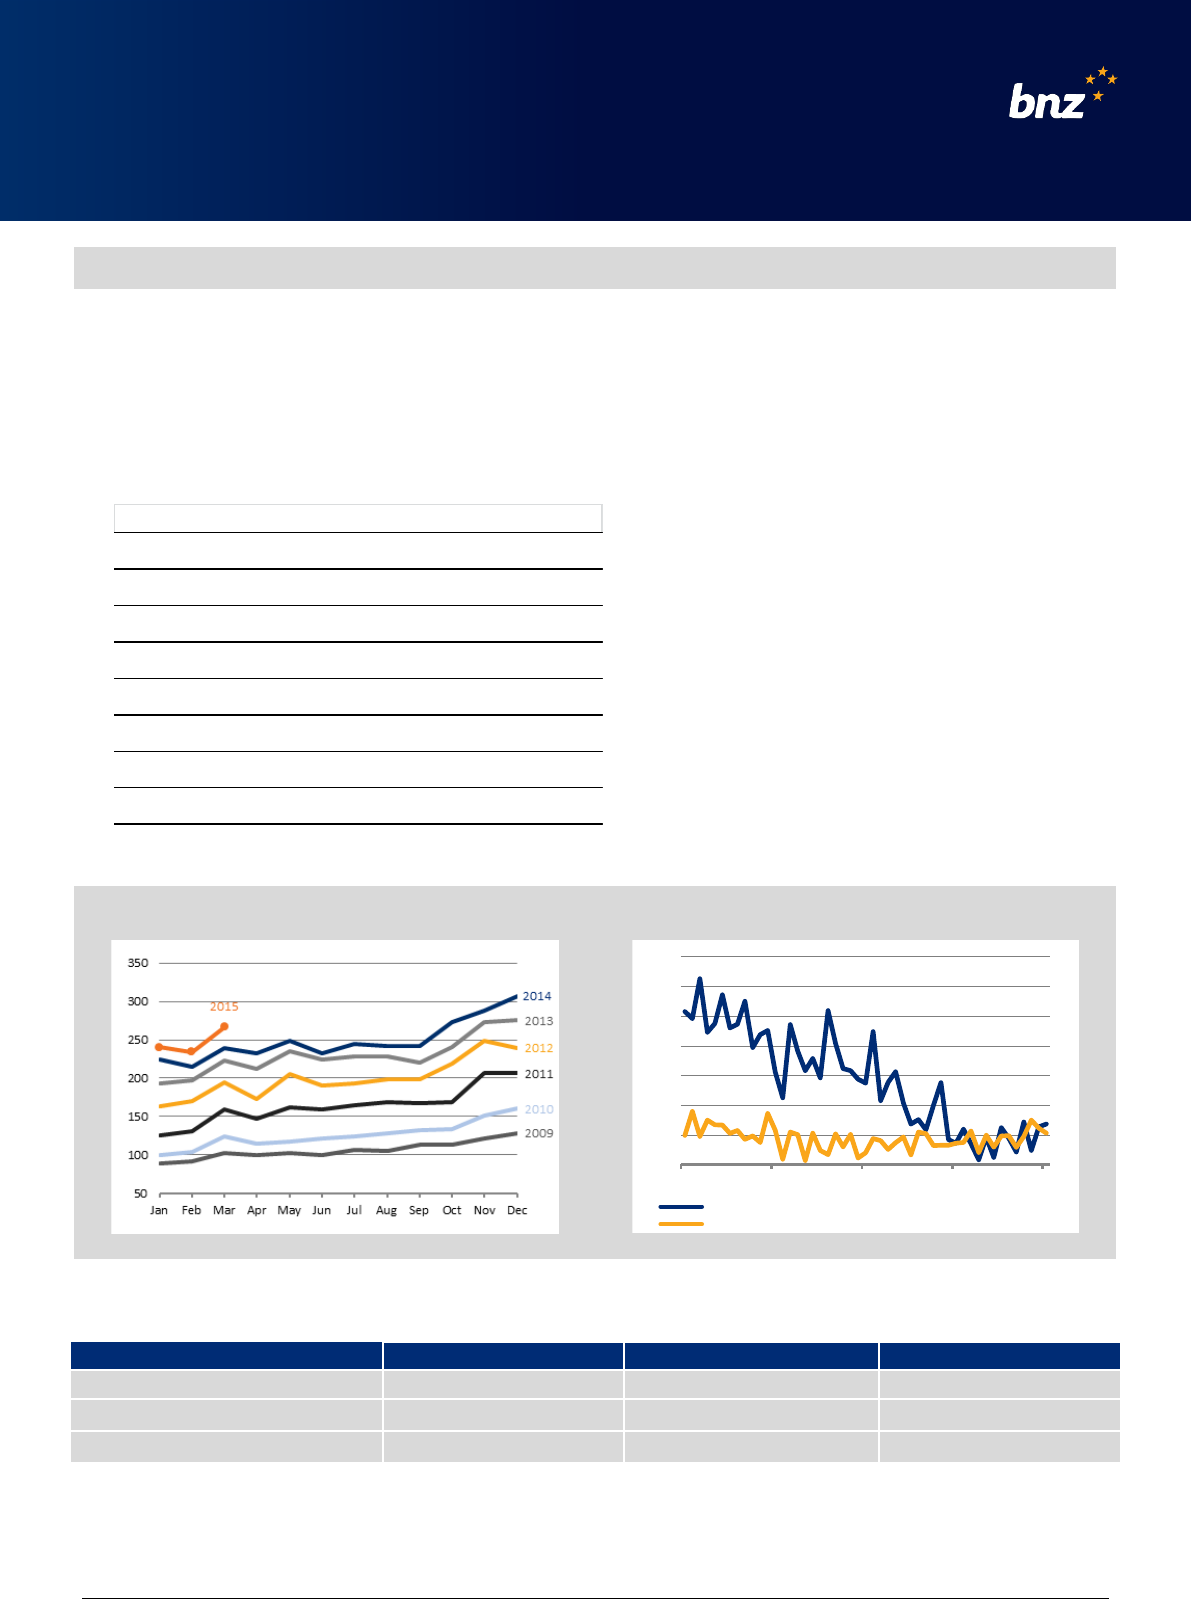
Total Online Retail Sales Index
January 2010 = 100
Domestic Retailers: Online sales vs Total sales using cards
Monthly spending compared to same month in prior year
Source: BNZ, Marketview
Source: BNZ and Marketview (online data); Statistics New Zealand (Electronic Cards data).
^
Using Statistics New Zealand data for the value of electronic card transactions (ECT) for “core retail” industries excluding hospitality. These transactions mostly relate to physical
stores, but do include an element of domestic online spending. The series is a reasonable comparator with our index of domes tic online spending in many respects, but isn’t a
perfect match.
Growth Rates
Total Online Index
Domestic Online Purchases
International Online Purchases
Month ended >>>
Jan-15
Feb-15
Mar-15
Jan-15
Feb-15
Mar-15
Jan-15
Feb-15
Mar-15
Monthly spending vs Same month prior year
7%
9%
11%
2%
6%
7%
14%
13%
18%
3-monthly average vs Same period prior year
8%
9%
9%
4%
5%
5%
14%
16%
15%
Data notes: Online sales data is produced by Marketview. Traditional retail sales data is from Statistics New Zealand quarterly releases. For both data sets, the figures we use correspond to Statistics New
Zealand’s ANZSIC Division G (Retail Trade) excluding fuel, motor vehicles and parts, and marine. The annual value of official retail sales in the categories we monitor is approximately $44 billion.
Categories included in the BNZ Online Retail Index are: supermarket and grocery stores; specialised food and liquor; furniture, floor coverings, houseware and textile goods; electrical and electronic goods;
hardware, building and garden supplies; recreational goods; clothing, footwear and personal accessories; department stores; pharmaceutical and other store-based retailing; non-store retailing; and retail
commission-based buying and/or selling.
Growth in total online spending (vs same month last year)
23%
Groceries & Liquor (incl health food and suppplements)
10%
Furniture, Housewares and Hardware
17%
Electrical & Electronic goods (incl computers & appliances)
9%
Recreation, Toys, Games, Entertainment media, Books
10%
Clothing, Footwear and Accessories
-17%
Daily Sales (at specialist sites)
10%
Variety, Department and Other*
14%
Pharmacy, Cosmetics, Stationery, Antiques, Flowers
0%
5%
10%
15%
20%
25%
30%
35%
Mar-11 Mar-12 Mar-13 Mar-14 Mar-15
Growth in value of online purchases from domestic retailers
Total sending at domestic retailers, using Electronic Cards (SNZ)^
Electrical goods and Groceries (including
specialised food such as supplements) are
categories growing particularly strongly:
Monthly online spending in these
categories is up 17% and 23% respectively
on March last year.
Together they are responsible for around
half of the increase in total online spending
by Kiwis over the past 12 months.
* Note: “Other” includes unclassified stores and specialty stores that don’t
neatly fit into defined ANZSIC categories. Unclassified Trade Me spending
(estimated retail component) is included with Department Store spending.