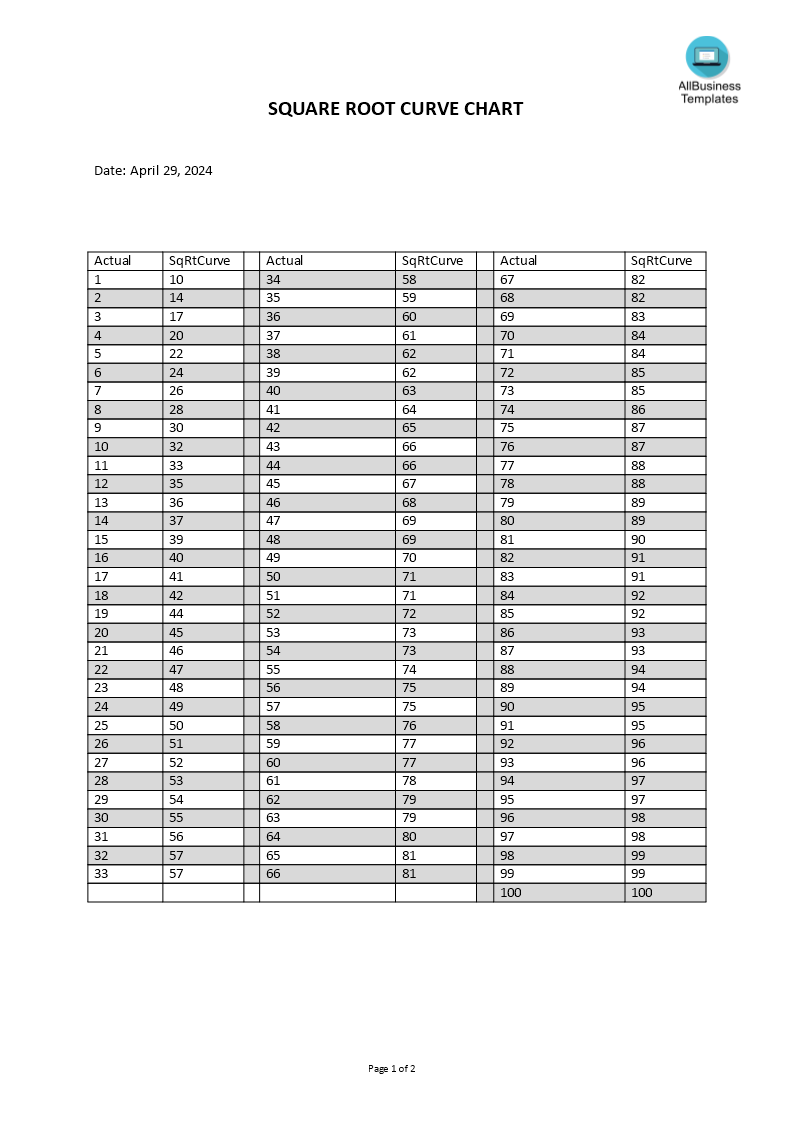
Square Root Curve Chart
Save, fill-In The Blanks, Print, Done!

Download Square Root Curve Chart
Microsoft Word (.docx)Or select the format you want and we convert it for you for free:
- This Document Has Been Certified by a Professional
- 100% customizable
- This is a digital download (62.98 kB)
- Language: English
- We recommend downloading this file onto your computer.

How to draft a Square Root Curve Chart? Are you in search of a square root curve chart template? Here you will find a graph template you can use to create a square root curve chart. This template is available to download and is easy to use. Give it a try and see how easy it is to create a chart! An easy way to start completing your document is to download this sample chart template now!
A square root curve chart is a graphical representation of data where the dependent variable is plotted on a logarithmic scale and the independent variable is represented using a square root function. This type of chart is used when the relationship between the variables is non-linear and the standard deviation or the variance of the data is high.
Purpose and Usage
The purpose of a square root curve chart is to show the relationship between two variables in a non-linear manner. It is often used in fields such as statistics, physics, and engineering to visualize and analyze the complexities and trends in the data.
Visual Representation
A square root curve chart consists of a horizontal axis representing the independent variable, typically time, and a vertical axis representing the dependent variable. The data points are plotted on the graph, and the x-values are plotted on a logarithmic scale while the y-values are calculated using a square root function.
Interpreting the Chart
When interpreting a square root curve chart, it is important to note that the shape of the curve and the position of the data points on the graph can provide valuable insights into the data.
1. Negative Relationship: If the curve slopes downward from left to right, it indicates a negative relationship between the variables. This means that as one variable increases, the other decreases.
2. Positive Relationship: If the curve slopes upward from left to right, it indicates a positive relationship between the variables. This means that as one variable increases, the other also increases.
3. Flat Curve: A flat curve indicates that the variables are not related or that the relationship is very weak.
4. Peaks and Troughs: The position and shape of the peaks and troughs on the chart can indicate significant events or trends in the data set.
5. Standard Deviation: The square root function used to compute the y-values represents the standard deviation of the data. Higher standard deviations indicate greater variability in the data.
Every day brings new projects, emails, documents, and task lists, and often it is not that different from the work you have done before. Many of our day-to-day tasks are similar to something we have done before. Don't reinvent the wheel every time you start to work on something new! A square root curve, or Texas curve, is designed to be easy to use and has the advantage of helping the lower scores more than the higher scores.
In mathematics, the square root is a number with a value. When this value is multiplied by itself, the original number is obtained. For example, 4 is a square, and the square root is 2 because 2 x 2 = 4. Now we provide this standardized Square Root Curve Chart template with text and formatting as a starting point to help professionalize the way you are working. Our private, business, and legal document templates are regularly screened by professionals. If time or quality is of the essence, this ready-made template can help you to save time and focus on the topics that matter!
Using this square root template guarantees you will save time, cost, and effort! It comes in Microsoft Office format, is ready to be tailored to your personal needs. Completing your file has never been easier!
Don't try to reinvent the wheel every time you start to work on something new! Download this Square Root Curve Chart template now for your benefit! This template will perfectly suit your needs! And after downloading you can craft and customize every detail of its appearance very quickly.
DISCLAIMER
Nothing on this site shall be considered legal advice and no attorney-client relationship is established.
Leave a Reply. If you have any questions or remarks, feel free to post them below.
Square Root Curve
How to make a Square Root Curve Chart? Seeking a reliable Square Root Curve chart to create your chart effortlessly? Check these Square Root Templates.
Read moreOther templates


Latest templates
Latest topics
- AI Cheat Sheet
How to Prompt Perfectly? Check out this 11 Essential AI Prompting Cheat Sheet, the Ultimate AI Prompt Engineering Guide! - T Chart Templates
Do you need free printable T Chart and T Table templates to make a comparison? Find here several T Chart templates in different extensions here all free to download! - Project Status Report Templates
How do you write a weekly status report? Find here Project status report templates and that can easily be changed and customized in every detail. - Top 15 mistakes or issues happening in the Real Estate Business!
Are you looking for real estate templates to improve your efficiency and effectiveness, and reduce the chance you are making mistakes with your real estate investments? These real estate templates will help you out! - Airbnb templates
Airbnb templates for those who are starting or having their own real estate business with short-term rental properties!
cheese