HTML Preview Graphics Template Language in SAS 9.2. page number 2.
PREPARING THE GRAPH DATA
The following code generates simulated clinical data with visit numbers, products, an absolute value with a standard
error (for the simple line plot), and a relative value (for the forest plot). The original data in sashelp.prdsal2 is very
uniform, so a filter is used to make the value counts less even.
PROC SQL;
CREATE TABLE plotdata AS
SELECT INTCK('QTR', '01jan1994'd, monyr) AS visitnum
,product
,MEAN(predict) AS value1 /* used for the simple line plots */
,STDERR(predict) AS value1_se /* used for the simple line plots */
,MEAN(predict) - 1200 AS value2 /* used for the forest plot */
,COUNT(*) AS count
FROM sashelp.prdsal2 (WHERE = (product IN ('BED','CHAIR','DESK')
AND predict > 400))
GROUP BY
visitnum
,product
;
QUIT;
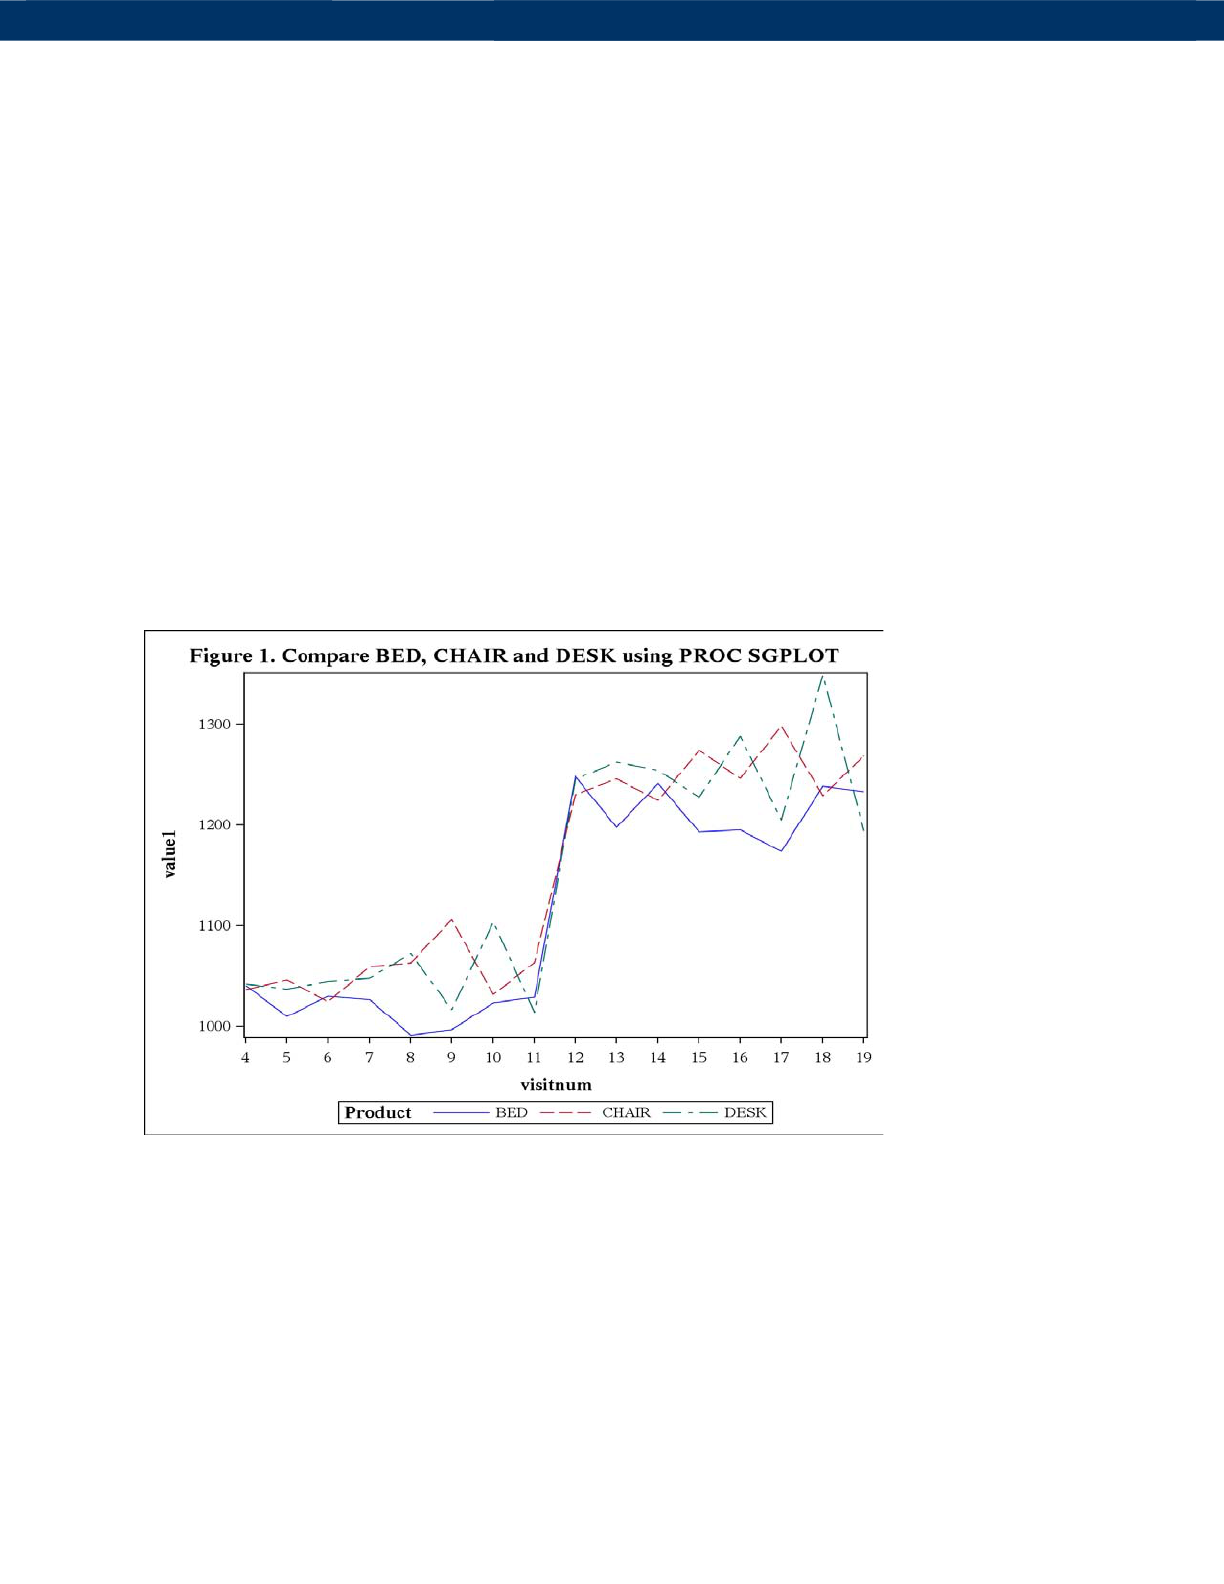
DRAWING GRAPHS WITH 'SG' PROCEDURES
It is possible to draw simple line plots using the 'SG' procedures introduced in SAS 9.2.
PROC SGPLOT DATA = plotdata;
TITLE 'Figure 1. Compare BED, CHAIR and DESK using PROC SGPLOT';
XAXIS TYPE = DISCRETE;
SERIES X = visitnum Y = value1 / GROUP = product;
RUN;
2
Re
p
ortin
g
and Information Visualization
SAS Global Forum 200
9