HTML Preview Graphics Template Language in SAS 9.2. page number 3.
SIMPLE LINE PLOTS
For more flexibility, we will be using GTL, below, to create more complex graphs.
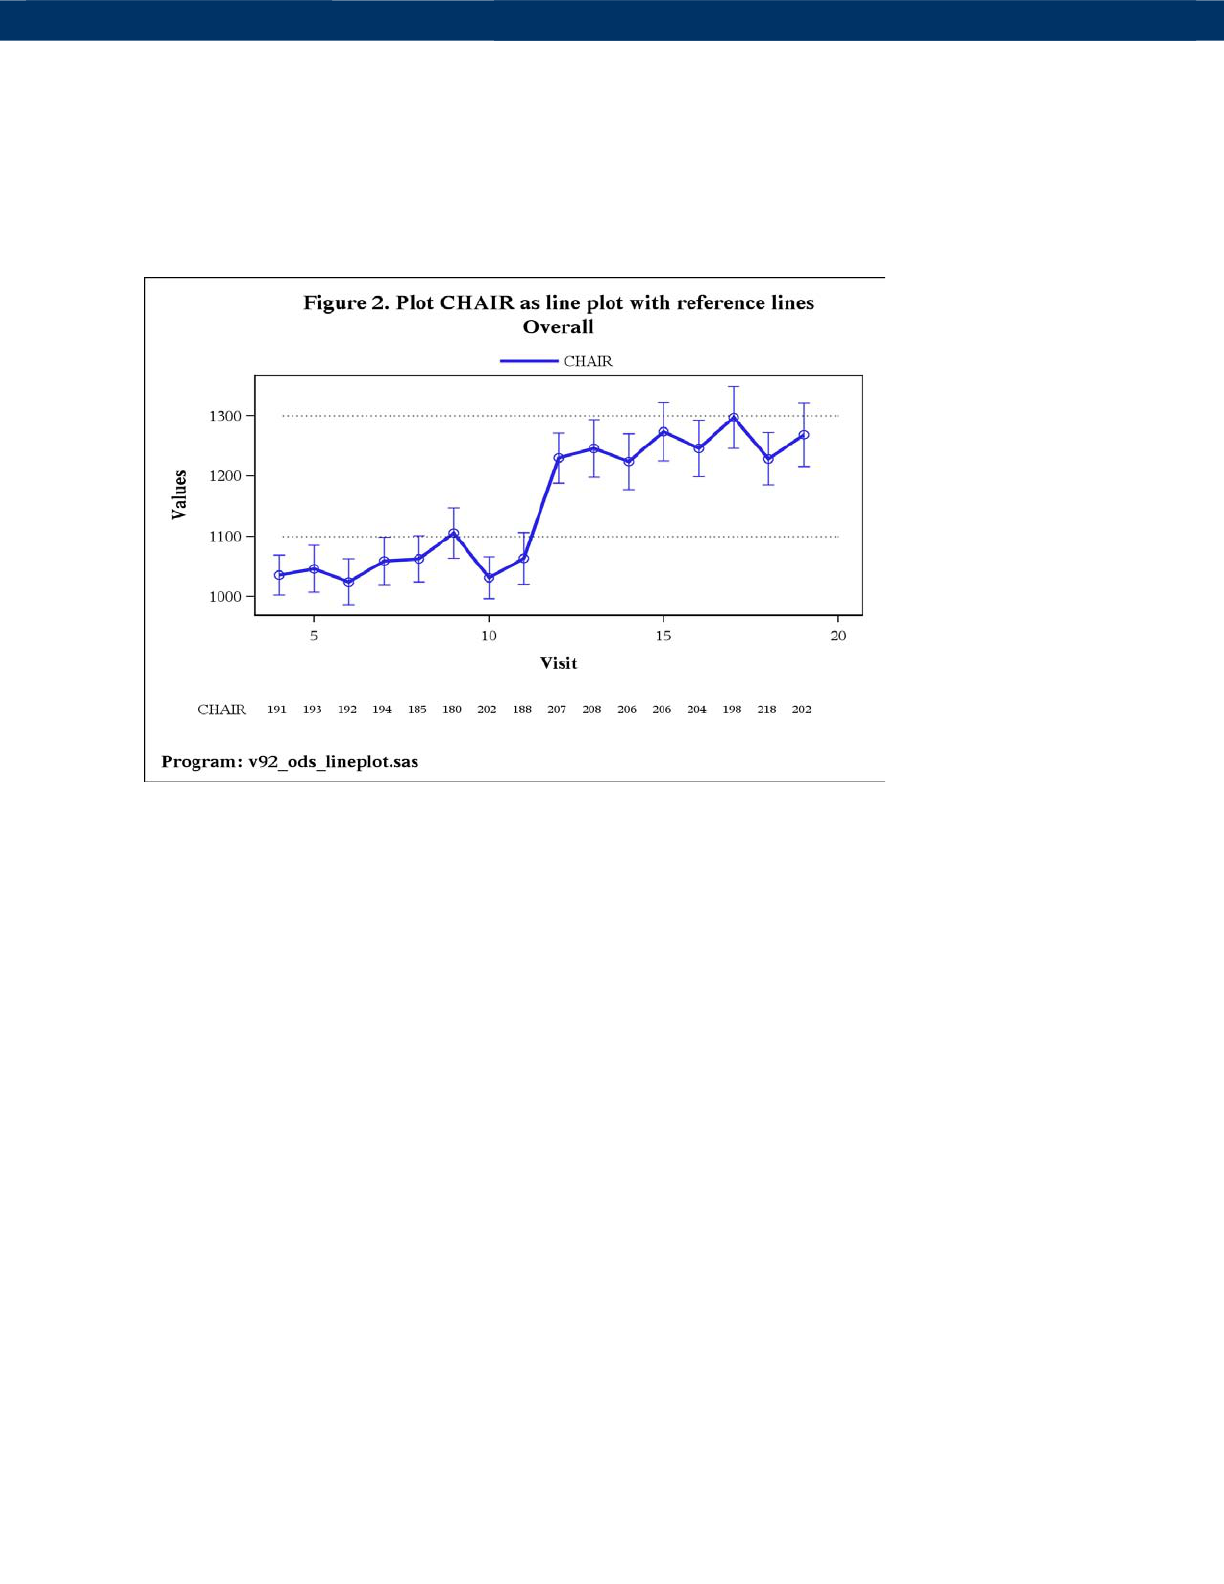
CREATE A LINE PLOT OF A SINGLE GROUP OF DATA POINTS WITH REFERENCE LINES
Generate the graph using a DATA step, with horizontal reference lines, converting the numeric counts to character
values, and calculating the upper and lower values of the error bars:
DEFINE THE TEMPLATE
Create the STATGRAPH template in work.mypath, then define the parameters and titles:
ODS PATH work.mypath(UPDATE) sashelp.tmplmst(READ);
PROC TEMPLATE;
DEFINE STATGRAPH Graphics.LinePlot;
DYNAMIC _title _title2 _title3
_footnote _footnote2 _footnote3
_xvar _xlabel _ylabel _yintercepta _yinterceptb
_yvar1 _yupper1 _ylower1 _nvar1 _group
;
BEGINGRAPH;
ENTRYTITLE _title;
ENTRYTITLE _title2;
ENTRYTITLE _title3;
Define the layout as 2 full-width areas with common horizontal axes, with the top area occupying 85% of the height
and the bottom area 15%. This split provides enough space to show 2 lines of counts, but the proportion allocated to
the bottom area should be increased to show more than 2 lines:
LAYOUT LATTICE /
COLUMNS = 1 ROWS = 2
ROWWEIGHTS = (.85 .15) COLUMNDATARANGE = UNIONALL
;
Define the top area and fill with an overlay of a series plot of connecting lines and a scatter plot of error bars:
LAYOUT OVERLAY /
PAD = (TOP = 2% BOTTOM = 2% LEFT = 2% RIGHT = 2%)
XAXISOPTS = (LABEL = _xlabel)
YAXISOPTS = (LABEL = _ylabel)
OPAQUE = FALSE
;
3
Re
p
ortin
g
and Information Visualization
SAS Global Forum 200
9