HTML Preview Graphics Template Language in SAS 9.2. page number 5.
DATA _NULL_;
LENGTH ccount $4;
SET plotdata (WHERE = (product = 'CHAIR'));
value1_upper = value1 + value1_se;
value1_lower = value1 - value1_se;
ccount = STRIP(PUT(count, 4.));
FILE PRINT ODS = (TEMPLATE = 'Graphics.LinePlot'
DYNAMIC = (_title =
"Figure 2. Plot CHAIR as line plot with reference lines"
_title2 = "Overall"
_footnote = "Program: &pgm..sas"
_xvar = "visitnum"
_xlabel = "Visit"
_ylabel = "Values"
_yintercepta = 1300
_yinterceptb = 1100
_yvar1 = "value1"
_yupper1 = "value1_upper"
_ylower1 = "value1_lower"
_nvar1 = "ccount"
_group = "product"
)
);
PUT _ODS_;
RUN;
ODS GRAPHICS OFF;
ODS RTF CLOSE;
CREATE A LINE PLOT OF 2 GROUPS OF DATA POINTS
Generate a similar graph as above using the same template, but removing the horizontal reference lines and adding
another group of data points:
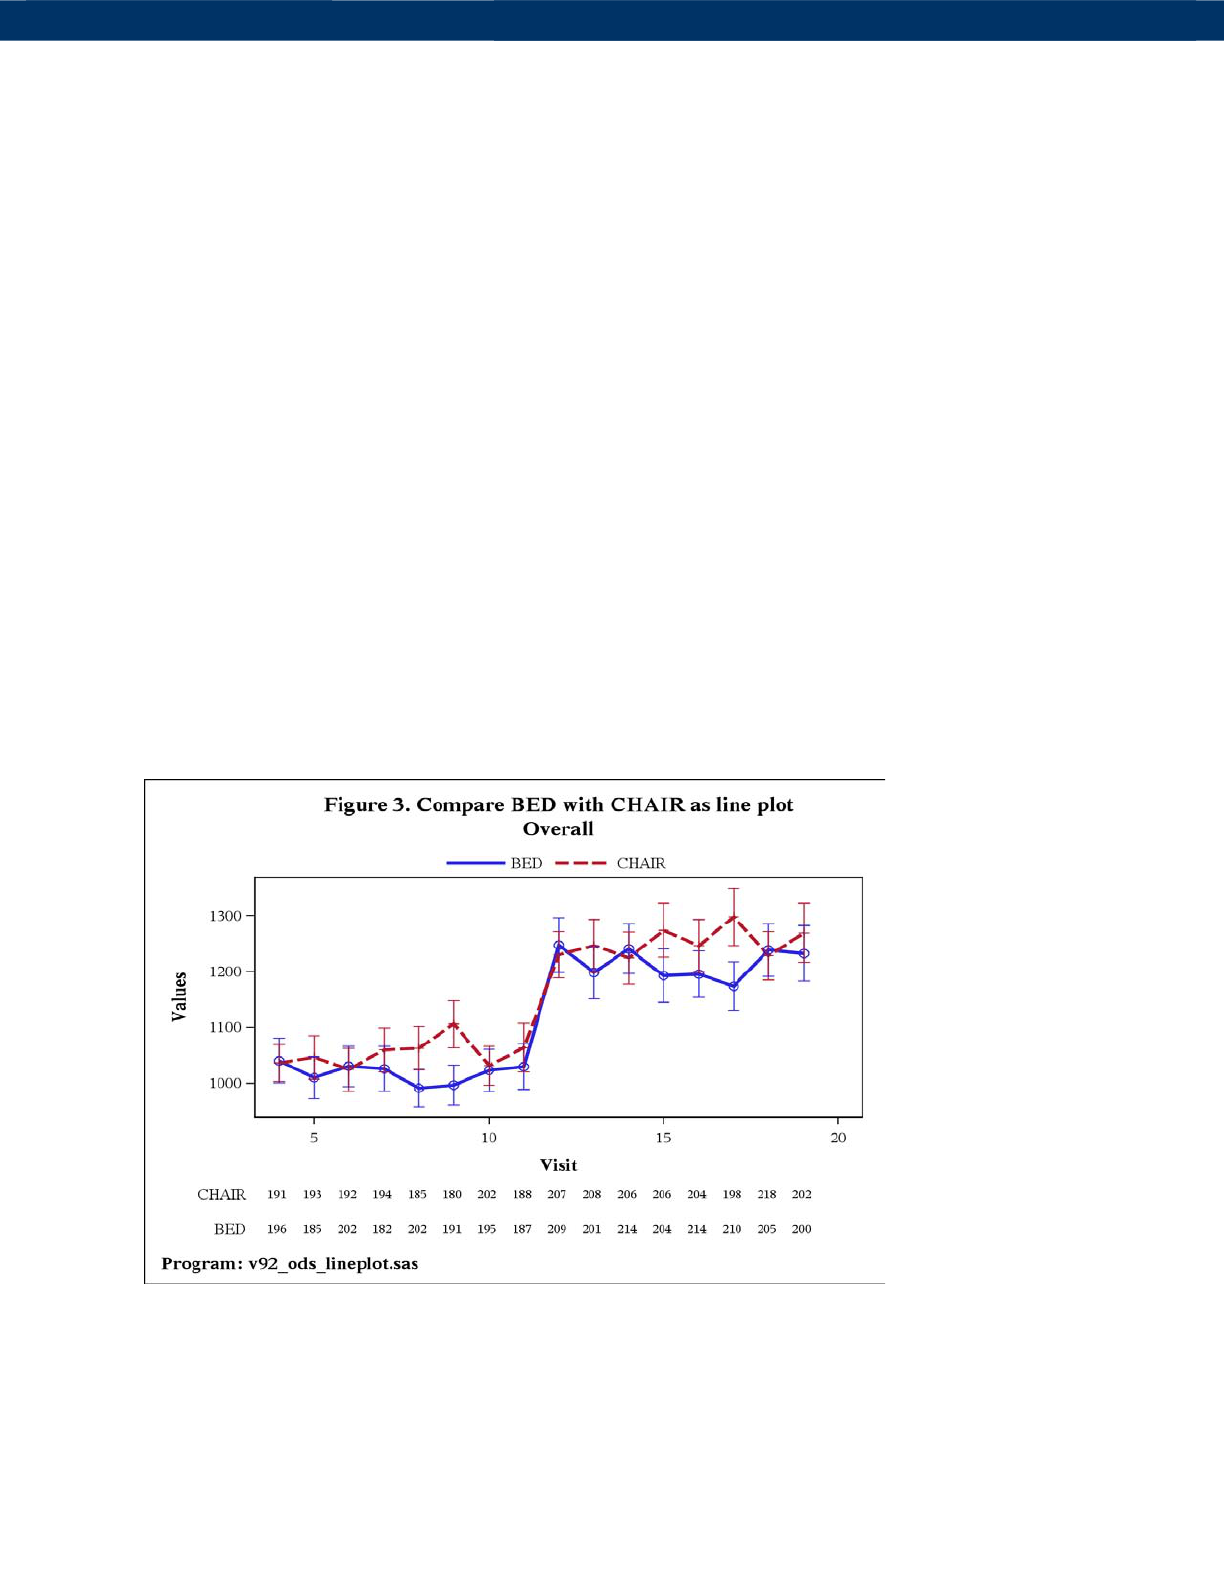
/*--- Figure 3: Compare BED with CHAIR as line plot ---*/
TITLE ' ';
ODS RTF FILE = "&pgm._bedchair.rtf" STYLE = serifprinter;
ODS GRAPHICS ON;
5
Re
p
ortin
g
and Information Visualization
SAS Global Forum 200
9