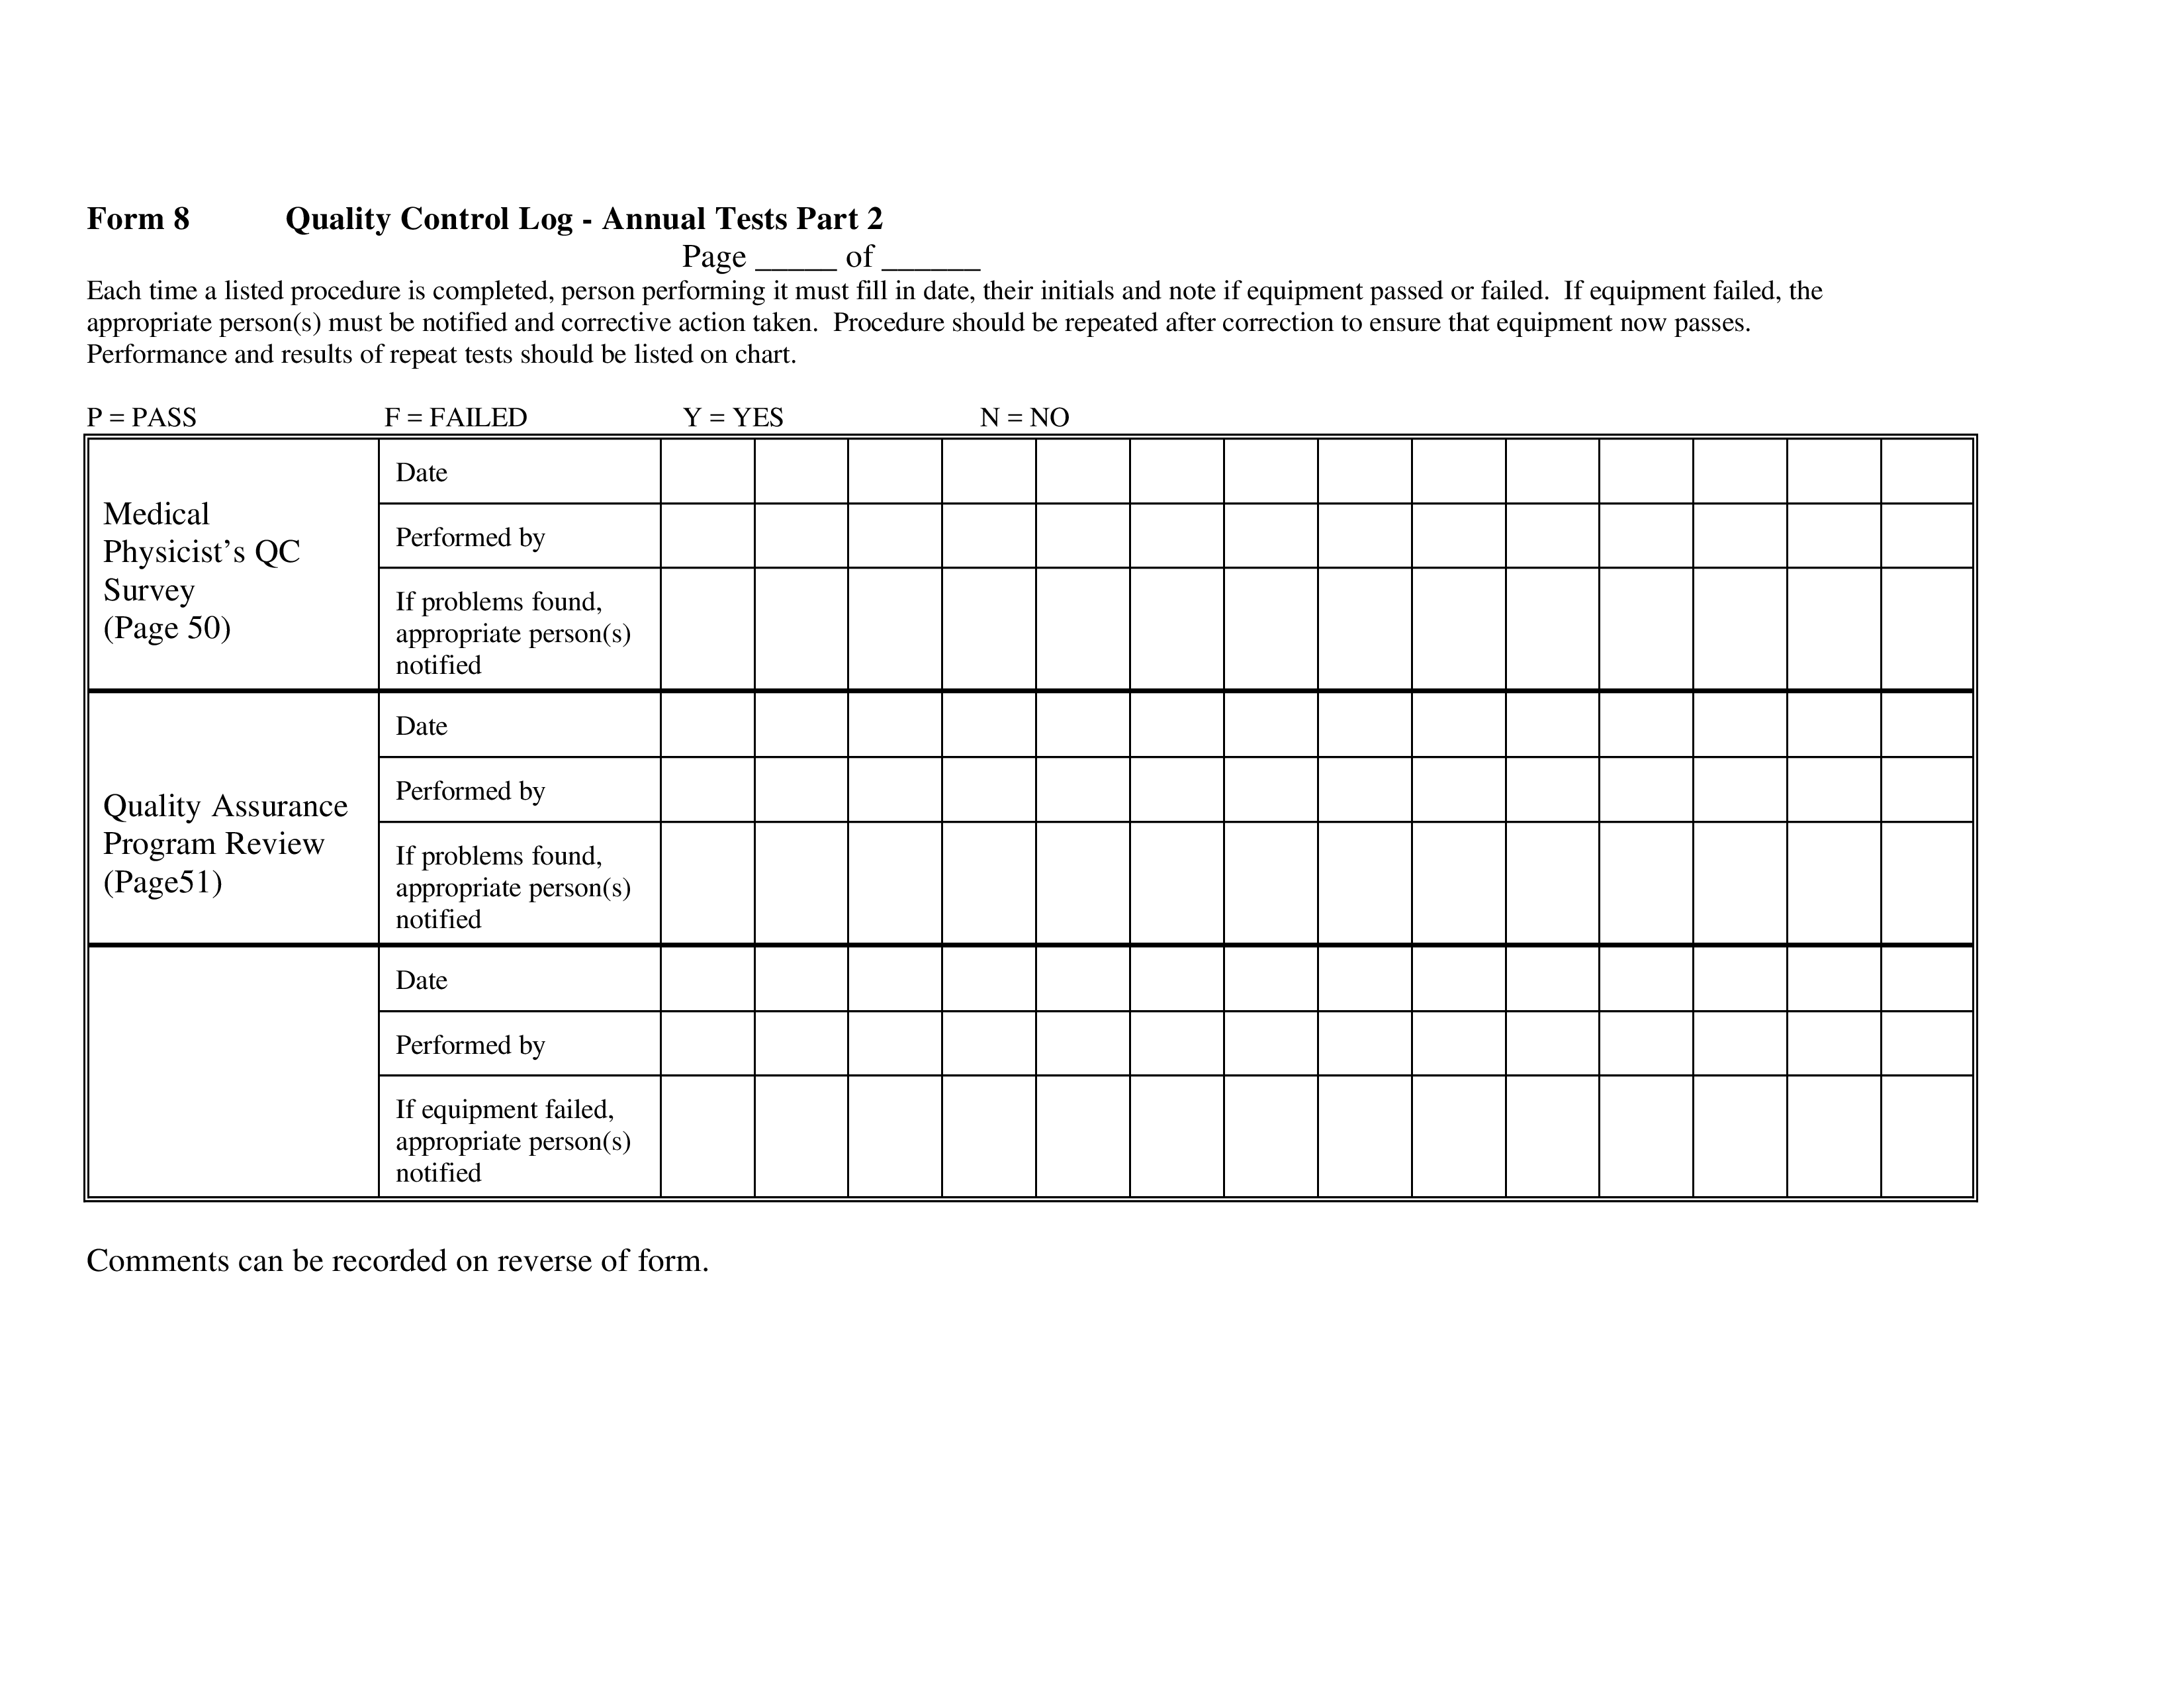
Blanco controle kaart
Save, fill-In The Blanks, Print, Done!

Download Blanco controle kaart
Adobe Acrobat (.pdf)Other languages available:
- This Document Has Been Certified by a Professional
- 100% customizable
- This is a digital download (132.1 kB)
- Language: Other
- We recommend downloading this file onto your computer.
Bent u op zoek naar lege controlediagram templates? Begin met voorbeeld lege controle diagram formulieren die kunnen worden gedownload en die kunnen worden afgedrukt.
De controlediagrammen in dit document zijn erg handig en de meest voorkomende soorten controlediagrammen, bijvoorbeeld het X-Bar-diagram (waarmee u het gemiddelde van een monster in de loop van de tijd kunt plotten). U kunt ook de S-kaart vinden (de standaarddeviatie van het monster uitzetten in de tijd en de R-kaart (om een bereik of Max-Min van een monster in de tijd uit te zetten).
Deze blanco controlediagrammen zijn gebaseerd op de gebruikte terminologie en dat verklaart de formules en stappen voor het maken van deze controlediagrammen. Dit bestand bevat lege sjablonen voor controlediagrammen die kunnen worden gebruikt voor statistische analyse. Bijvoorbeeld voor gemiddelde en bereik, of steekproef gemiddelde en standaarddeviatie (2 werkbladen in één). U kunt uw eigen gegevens gewoon in de grafieken plaatsen om de gegevens te visualiseren. Controlelimieten worden berekend op basis van de gegevens die u invoert. In de X-bar & R-controlekaart kan het aantal waarnemingen per monster (n) tussen 2 en 25 liggen. In de X-bar & S-grafiek moet n groter zijn dan 4.
Hoewel er veel softwareprogramma's voor statistische procesbesturing (SPC) beschikbaar zijn om gegevens te analyseren en te visualiseren, komt het voor dat onderzoekers ook controlediagrammen maken in Excel of op papier.
Daarvoor kunnen deze lege sjablonen voor controlediagrammen erg handig zijn. Het kan ook dienen als educatieve hulpmiddelen om kinderen of volwassenen te onderwijzen en vergelijkingen te maken.
Download deze blanco controle kaarten nu.
Mid-density (MD) Step Average density Density difference (DD) = HD - LD High-Density (HD) Low-density (LD) 17 18 19 20 21 B+F Form 3 Cross-Over Data Sheet Date Performed: Base + Fog Old Emulsion Data New Emulsion Data Old Emulsion New Emulsion MD LD HD Base + Fog MD LD HD Strip 1 Strip 2 Strip 3 Strip 4 Strip 5 Average Density Difference = HD - LD Density Difference = HD – LD DD = DD = Determining Differences Between Old and New Emulsions Base + Fog MD Determining New Operating Level from Old Level and Differences DD Base + Fog New Emulsion Average Difference (New-Old) Old Emulsion Average Old Operating Level Difference (New-Old) New Operating Level (Diff +Old) MD DD Form 2 Laser Film Printer Control Chart Year: ___________ Laser Film Printer: ____________ Film: ________________________ Month Day Initials 0 2.6 2.45 2.3 10 2.25 2.10 1.95 40 1.00 1.15 1.30 90 0.22 0.3 0.38 5 visible in 0 95 visible in 100 Date Remarks/Action Taken Form 5 Quality Control Log - Bimonthly Tests Page _____ of ______ Each time a listed procedure is completed, person performing it must fill in date, their initials and note if equipment passed or failed..
DISCLAIMER
Nothing on this site shall be considered legal advice and no attorney-client relationship is established.
Leave a Reply. If you have any questions or remarks, feel free to post them below.
Related templates
Latest templates
Latest topics
- Flyer Template
Creating strong marketing materials that support your marketing strategy, such as flyers or online promotion (banners, ads) are an important part of growing a successful business! - Hourly Weekly Schedule Template
How do I make an hourly schedule? Streamline your daily planning with our versatile hourly daily weekly schedule templates - Excel Templates
Where do I find templates for Excel? How do I create a template in Excel? Check these editable and printable Excel Templates and download them directly! - GDPR Compliance Templates
What do you need to become GDPR compliant? Are you looking for useful GDPR document templates to make you compliant? All these compliance documents will be available to download instantly... - Daily Report Sheets For Preschool
How do you create a kindergarten schedule or write a daily report for a preschool? Check out these preschool templates here.
cheese


