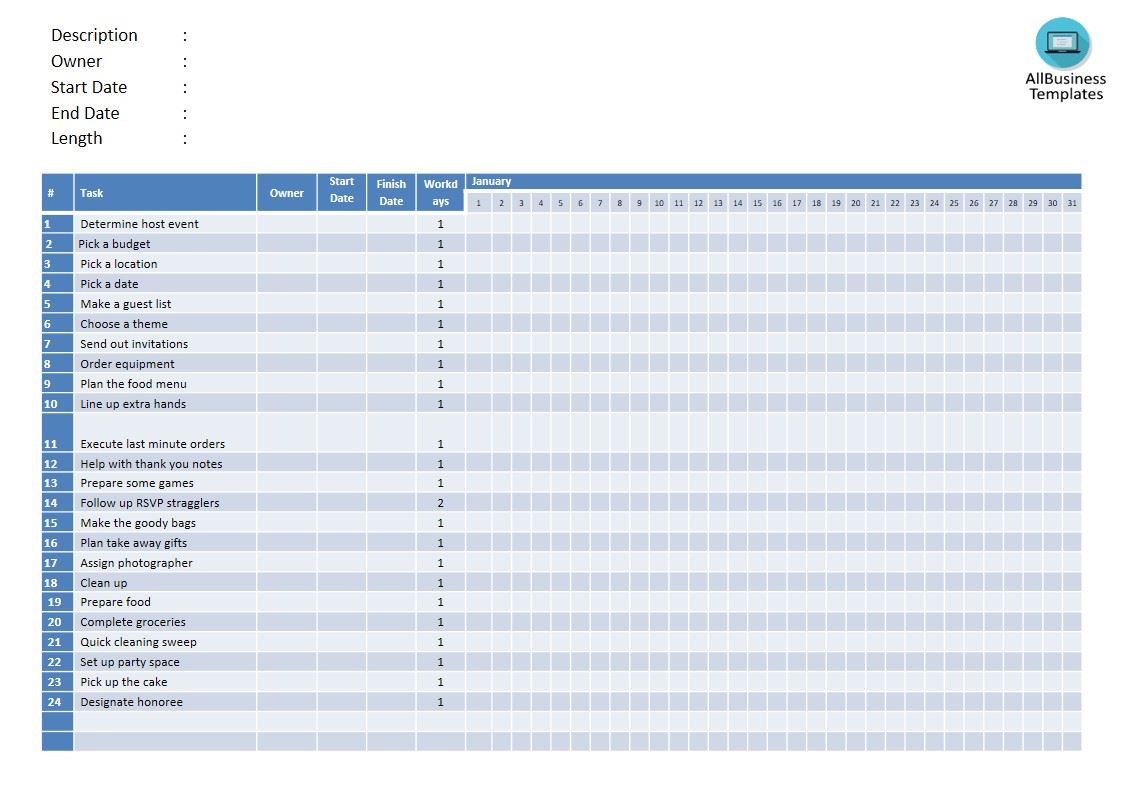
Gantt Chart PowerPoint template
Save, fill-In The Blanks, Print, Done!

Download Gantt Chart PowerPoint template
(.pptx)Other languages available:
- This Document Has Been Certified by a Professional
- 100% customizable
- This is a digital download (35.61 kB)
- Language: English
- We recommend downloading this file onto your computer.

How to create a Gantt chart in PowerPoint? What is a Gantt chart and what is a Gantt chart used for? We have a sample template available for you to use immediately. Our templates are easy to use and can be customized to fit your needs. Download this free Gantt Chart PPT template and start using it for your current projects.
A Gantt chart can be a very efficient and effective project management tool, and they are a very popular method to put your needs and project goals clear on paper. Gantt charts are seen as a progressive technique when first introduced.
It is considered one of the best project management tools. A Gantt chart is a kind of bar diagram, invented by Henry Gantt in the 1910s, that outlines a company or project schedule. Gantt charts outline the beginning and completion dates of the elementary components of a project. The total of all elementary project components can be called "the work breakdown structure of the project".
Advanced Gantt charts additionally demonstrate the reliance (i.e., priority) connections between deliverables. Gnatt chart can be applied to show the current project status by informing the percentage of successful completion of the project, and a vertical "TODAY" line can be implemented here as well.
Advanced Gantt charts additionally demonstrate the reliance (i.e., priority) connections between deliverables. Gnatt chart can be applied to show the current project status by informing the percentage of successful completion of the project, and a vertical "TODAY" line can be implemented here as well.
Their specific outline is additionally used as a part of data innovation to communicate information to the project team and stakeholders.
This Gantt Chart can directly be downloaded as a Powerpoint PPT template. It is not Gantt Chart software and doesn't contain Macro's or whatsoever.
How do you make a Gantt Chart in PowerPoint?
Creating a Gantt Chart in PowerPoint involves using the built-in chart tools. Here's a step-by-step guide:
- Open PowerPoint:
- Launch Microsoft PowerPoint on your computer.
- Create a New Slide:
- Open a new or existing presentation and navigate to the slide where you want to insert the Gantt Chart.
- Insert a Stacked Bar Chart:
- Click on the "Insert" tab in the PowerPoint ribbon.
- In the "Illustrations" group, click on "Chart" or "SmartArt" (this may vary depending on your version of PowerPoint).
- Choose a stacked bar chart. This type of chart is suitable for creating Gantt Charts.
- Enter Your Data:
- A data sheet or a pop-up window will appear. Enter your task data, including task names, start dates, and durations. Each row represents a task, and the columns represent the task details.
- Make sure your data includes information about the start date, duration, and any other relevant details.
- Format the Gantt Chart:
- After entering your data, PowerPoint will generate a basic Gantt Chart. You can format it to make it visually appealing and better suited to your presentation.
- Adjust colors, fonts, labels, and other formatting options as needed. Right-click on different elements of the chart to access formatting options.
- Adjust Dates and Duration:
- Ensure that the horizontal axis accurately represents the timeline of your project. You may need to adjust dates and durations by clicking on the chart elements and modifying the data.
- Add Task Dependencies and Milestones:
- If your project involves task dependencies, you can represent them using arrows or lines. To do this, you may need to use PowerPoint's drawing tools.
- Similarly, if there are milestones, consider adding symbols or markers to indicate them.
- Update and Modify:
- PowerPoint allows you to easily update and modify your Gantt Chart. You can add or remove tasks, adjust dates, and make other changes as your project progresses.
Remember that while PowerPoint can be a useful tool for creating Gantt Charts, it may not have the advanced project management features found in dedicated project management software. For more complex projects, you may want to consider using specialized project management tools that offer additional functionalities and collaboration features.
Our template enables you to create free Gantt chart to structure your thoughts on every detail in a professional way! This Gantt Chart template will help you to reach the next level of success in your work, education, and business.
Download this free Gantt Chart PPT template!
DISCLAIMER
Nothing on this site shall be considered legal advice and no attorney-client relationship is established.
Leave a Reply. If you have any questions or remarks, feel free to post them below.
Other templates


Latest templates
Latest topics
- CyberSecurity Standards
Shield Your Business: Essential Cybersecurity Standards & Compliance Toolkits What are important CyberSecurity Standards? Check out our CyberSecurity Standard templates, including policies, controls, processes, checklists, procedures. - Sheet Music Free
Free Printable Blank Sheet Music & Staff Paper, if you just want to compose music, which will get you easily started and will save you costs. - Sales Letter
How to Write a High-Converting Sales Letter? Check out these sales letter templates and impress your customers with a professional sales letter directly! - APA format template
Find APA style templates as created by the American Psychology Association, Academic documents such as books and journal articles follow APA style (also known as APA format) - Resignation Checklist
What's important to do when you want to resign and write a resignation letter to your employer? Check out this Resignation Checklist for your reference.
cheese