Genogram Example
Save, fill-In The Blanks, Print, Done!

Download Genogram Example
Microsoft Word (.docx)Or select the format you want and we convert it for you for free:
- This Document Has Been Certified by a Professional
- 100% customizable
- This is a digital download (100.04 kB)
- Language: English
- We recommend downloading this file onto your computer.

How to make a Genogram example and how to structure your search? What is the format for a genogram? Genogram templates are a useful tool for visualizing a family's relationships and dynamics. They can help to identify patterns, such as addiction, mental illness, or substance abuse. Genogram templates can also be used to uncover potential solutions to problems or identify potential areas of conflict. Complete your search now with this easily editable sample template.
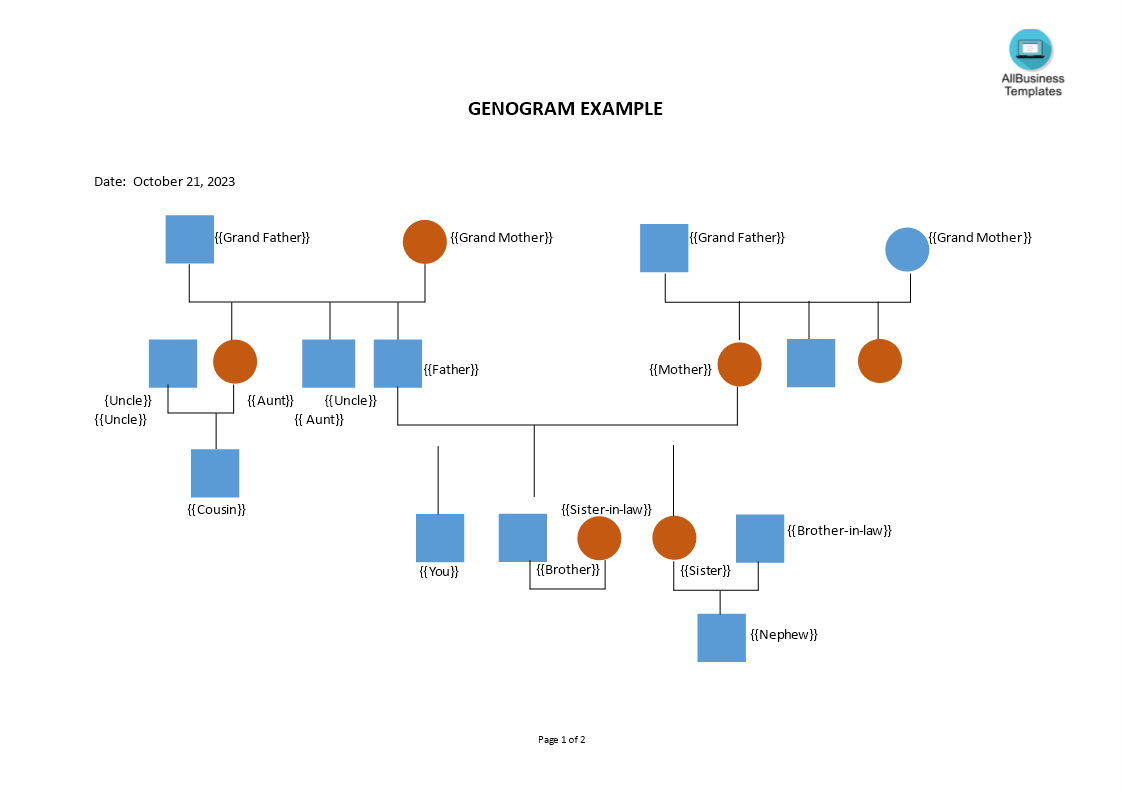
A genogram is a visual representation of a family's structure and relationships. It is a diagram that displays detailed information about family members and their connections, often used in fields like psychology, social work, medicine, and genetics to assess and illustrate family dynamics, medical histories, and hereditary patterns. Genograms are similar to family trees but are more detailed and include information about emotional relationships, health issues, and other significant factors.
Key elements typically included in a genogram:
- Family Members: Each family member is represented by a symbol (usually a circle for females and a square for males). Names and often additional information like birth and death dates may be included.
- Relationships: Lines between family members indicate relationships. Marriages or partnerships are represented by horizontal lines, and vertical lines connect parents to their children.
- Generations: Family members are organized by generations, with older generations at the top and younger generations below.
- Symbols: Various symbols, lines, and colors are used to denote different types of relationships, emotional dynamics, and other factors. For example, dashed lines might indicate divorce, and specific symbols may represent health conditions or emotional relationships.
- Emotional Relationships: Genograms can depict emotional connections between family members, such as conflicts, alliances, or supportive relationships. This is a unique aspect of genograms compared to traditional family trees.
- Health Information: Relevant medical or psychological information may be added to indicate health conditions or patterns of illness within the family.
- Life Events: Major life events like births, deaths, adoptions, or significant life changes are often noted.
- Color Coding: Colors may be used to represent various categories or characteristics, such as health conditions, family roles, or other relevant distinctions.
Genograms are valuable tools for professionals in various fields to gain insights into family dynamics, hereditary patterns, and social and psychological influences within a family system. They can be used in therapy to help individuals and families understand and work through their issues, in healthcare to identify patterns of hereditary diseases, or in social work to assess and support families in need. The level of detail and complexity in a genogram can vary depending on its intended use and the specific information needed.
Download this inspiring Genogram example now and complete your family history research for your reference.
DISCLAIMER
Nothing on this site shall be considered legal advice and no attorney-client relationship is established.
Leave a Reply. If you have any questions or remarks, feel free to post them below.
Family Tree Templates
Do you want a medical family tree, a public official family tree or a simple one to explain family members to your kids. We have it all for you.
Read moreLatest templates
Latest topics
- AI Cheat Sheet
How to Prompt Perfectly? Check out this 11 Essential AI Prompting Cheat Sheet, the Ultimate AI Prompt Engineering Guide! - Letter Format
How to proper format a letter? Here is a brief overview of common letter formats and templates in USA and UK and get inspirited immediately! - Excel Templates
Where to find usefl Excel templates? How do I create a template in Excel? Check these editable and printable Excel Templates and download them directly! - GDPR Compliance Templates
What You Need To Be DPR compliant? Are you looking for useful GDPR document templates to make you compliant? All these compliance documents will be available to download instantly... - Authorization Letter To Claim
How to write an authorization letter that gets results? Check out our authorization letter sample and formats for an act on behalf, claiming, collect document, pick up & process documents, etc
cheese