Simple Gantt Chart Excel template
Save, fill-In The Blanks, Print, Done!

Download Simple Gantt Chart Excel template
Microsoft Spreadsheet (.xls)Or select the format you want and we convert it for you for free:
- This Document Has Been Certified by a Professional
- 100% customizable
- This is a digital download (69 kB)
- Language: English
- We recommend downloading this file onto your computer.

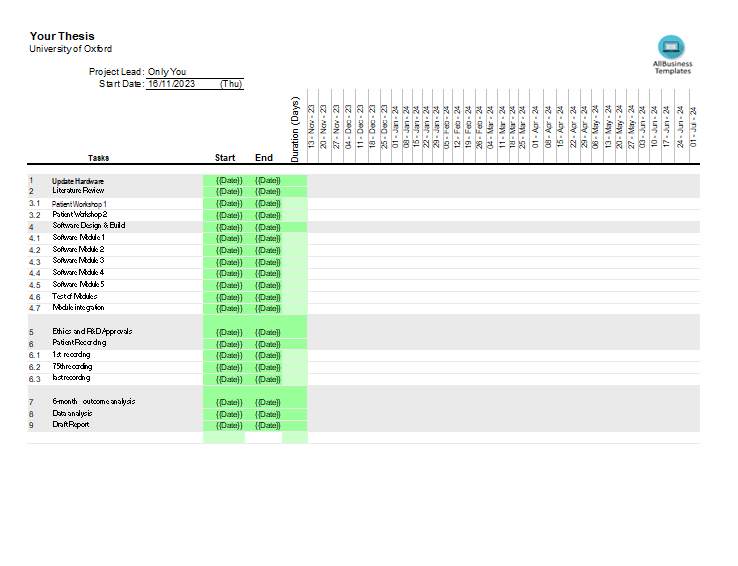
How to create a simple Gantt Chart Excel? Are you searching for a Simple Gantt Chart Excel template? Our sample template has everything you need to create a successful project plan. It includes a timeline, tasks, milestones, and progress tracking. It's a simple, yet powerful template to help you manage your project.
A Gantt Chart is a visual representation of a project schedule that shows the start and finish dates of various elements of a project. It provides a graphical illustration of a project's timeline, tasks, and their dependencies.
Creating a simple Gantt Chart in Excel involves using a stacked bar chart and customizing it to represent your project timeline. Here are step-by-step instructions:
- Data Setup:
- Open Excel and create a new worksheet.
- Set up your data with the following columns: Task Name, Start Date, Duration.
- Insert a Stacked Bar Chart:
- Highlight your data, including the headers.
- Go to the "Insert" tab on the Ribbon.
- Click on "Bar Chart" and select "Stacked Bar."
- Format the Chart:
- Your chart may look like a simple bar chart at this point. Right-click on the chart and choose "Select Data."
- Click "Add" to add a new series. For the "Series values," select your "Start Date" column. For the "Category axis labels," choose your "Task Name" column.
- Now, you should have two series in your chart. Click "OK" to close the "Select Data Source" window.
- Adjust Dates:
- Your chart might not display dates on the horizontal axis correctly. Right-click on the horizontal axis and select "Format Axis."
- Under the "Axis Options" tab, set the "Minimum" bound to your project start date and the "Maximum" bound to your project end date. Adjust other options as needed.
- Format the Bars:
- Format the bars to represent the duration of each task. Click on one of the bars, right-click, and choose "Format Data Series."
- In the "Format Data Series" pane, adjust the "Gap Width" to make the bars wider or narrower.
- You can also change the bar color to make the chart more visually appealing.
- Add Milestones (Optional):
- If you have important milestones in your project, you can add them to the Gantt Chart. Simply insert another series for milestone dates and format them differently, for example, using a different color or marker style.
- Final Touches:
- Add axis titles, a chart title, and any other labels to make your Gantt Chart more informative.
- Customize the legend and any other chart elements as needed.
Remember that this is a basic Gantt Chart in Excel, and more advanced project management tools may offer additional features and automation. As your project progresses, you may need to update the chart manually to reflect changes in task durations or timelines.
Using this Gantt Chart Excel template guarantees you will save time, cost and efforts! Completing documents has never been easier!
Download this Gantt Chart Excel template now for your own benefit!
DISCLAIMER
Nothing on this site shall be considered legal advice and no attorney-client relationship is established.
Leave a Reply. If you have any questions or remarks, feel free to post them below.
Other templates


Latest templates
Latest topics
- AI Cheat Sheet
How to Prompt Perfectly? Check out this 11 Essential AI Prompting Cheat Sheet, the Ultimate AI Prompt Engineering Guide! - T Chart Templates
Do you need free printable T Chart and T Table templates to make a comparison? Find here several T Chart templates in different extensions here all free to download! - Project Status Report Templates
How do you write a weekly status report? Find here Project status report templates and that can easily be changed and customized in every detail. - Top 15 mistakes or issues happening in the Real Estate Business!
Are you looking for real estate templates to improve your efficiency and effectiveness, and reduce the chance you are making mistakes with your real estate investments? These real estate templates will help you out! - Airbnb templates
Airbnb templates for those who are starting or having their own real estate business with short-term rental properties!
cheese