Excel Dashboard Report
Save, fill-In The Blanks, Print, Done!

Download Excel Dashboard Report
Microsoft Spreadsheet (.xls)Or select the format you want and we convert it for you for free:
- This Document Has Been Certified by a Professional
- 100% customizable
- This is a digital download (24.5 kB)
- Language: English
- We recommend downloading this file onto your computer.

How to create a Excel Dashboard Report? An easy way to start completing your document is to download this example Excel Dashboard Report template now!
We provide this Excel Dashboard Report template to help professionalize the way you are working. Our business and legal templates are regularly screened and used by professionals. If time or quality is of the essence, this ready-made template can help you to save time and to focus on the topics that really matter!
Using this Excel Dashboard Report template guarantees you will save time, cost and efforts! Completing documents has never been easier!
Download this Excel Dashboard Report template now for your own benefit!
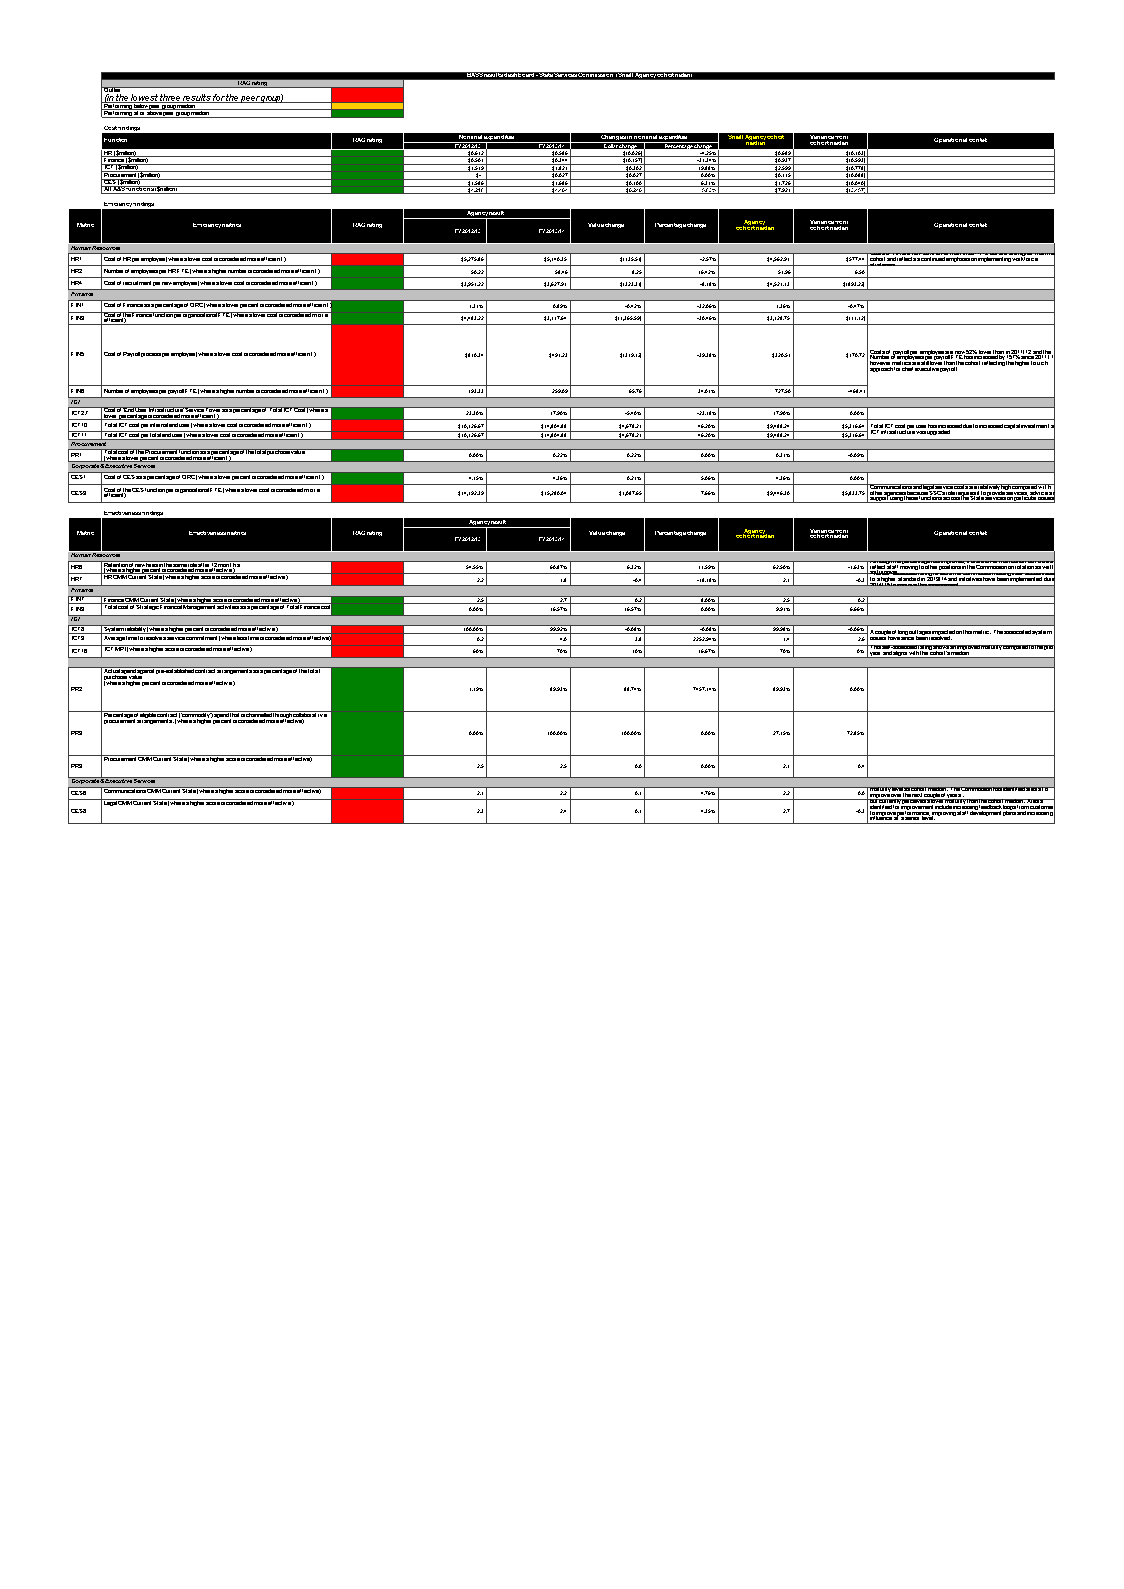
,BASS results dashboard - State Services Commission (Small Agency cohort median),,,, ,RAG rating,,,, ,"Outlier (in the lowest three results for the peer group)",,,, ,Performing below peer group median,,,, ,Performing at or above peer group median,,,, ,,,,, ,Cost findings,,,, ,Function,RAG rating,Nominal expenditure,Changes in nominal expenditure,Small Agency cohort median,"Variance from cohort median ",Operational context ,,FY 2012/13 ,FY 2013/14 ,Dollar change ,Percentage change,, ,HR ( million),"0,612","0,586","-0,026","-4,2483660130719 ","0,689","-0,103", ,Finance ( million),"0,501","0,344","-0,157","-31,3373253493014 ","0,937","-0,593", ,ICT ( million),"1,519","1,821","0,302","19,8815009874918 ","2,599","-0,778", ,Procurement ( million),0,"0,027","0,027",0 ,"0,115","-0,088", ,CES ( million),"1,586","1,686","0,0999999999999999","6,30517023959646 ","1,726","-0,04", ,All A S functions ( million),"4,218","4,464","0,246","5,83214793741111 ","7,921","-3,457", ,,,,, ,Efficiency findings,,,, Metric,Efficiency metrics,RAG rating,Agency result ,Value change ,Percentage change ,"Agency cohort median ","Variance from cohort median ",Operational context ,,FY 2012/13 ,FY 2013/14 ,,Small Agency cohort median, Human Resources,,,,, HR1,Cost of HR per employee (where a lower cost is considered more efficient),"5275,8621","5140,3509","-135,5112","-2,56851292606757 ","4562,9139","577,437000000001",Costs of HR are now 26 lower than in 2011/12 but are still higher than the cohort and reflects a continued emphasis on implementing workforce strategies HR2,Number of employees per HR FTE (where a higher number is considered more efficient),"50,2165","58,4615","8,245","16,4189061364293 ","51,9643","6,4972", HR4,Cost of recruitment per new employee (where a lower cost is considered more efficient),"3951,2195","3627,907","-323,3125","-8,18260033389691 ","4521,1268","-893,2198", Finance,,,,, FIN1,Cost of Finance as a percentage of
DISCLAIMER
Nothing on this site shall be considered legal advice and no attorney-client relationship is established.
Leave a Reply. If you have any questions or remarks, feel free to post them below.
Related templates
Latest templates
Latest topics
- GDPR Compliance Templates
What do you need to become GDPR compliant? Are you looking for useful GDPR document templates to make you compliant? All these compliance documents will be available to download instantly... - Warning Letter to Employee
How to write a warning letter for employee? Download our Warning letter to employee templates here and modify according to your preferences. - Wedding Invitation Templates
How to get free wedding invitation templates? Where to find Do It Yourself Wedding invitations templates? Download them here! - Google Docs Templates
How to create documents in Google Docs? We provide Google Docs compatible template and these are the reasons why it's useful to work with Google Docs... - Play Money Template
Where to download cool Play Money templates? Download below our printable and customizable Play Money templates for fun or with space for your face template now!
cheese